News

01-27-2013
 New Books
Visit the Books Page on the homepage to See our Latest Releases
New BooksVisit the Books Page on the homepage to See our Latest Releases
Using Portals in the Sun to Forecast the Dow Jones Industrial Average Return to Homepage
Go to Article Index
Published 2016- Wormhole Theories, Sunspot Activity and Remote Viewing Stocks
View Chapters
 Read the first 3 Chapters Free
View the latest Associative Dow Jones Remote Viewing Sessions
View the latest Associative Dow Jones Remote Viewing Sessions
Published August 2017. Remote Viewing. The Complete User&Î39;s
Manual on Experiencing Future Consciousness
A complete summary and analysis of all 76 Associative Remote Viewing Sessions over 2 years
including Remote Viewing Hardware Technology you can build to Enhance Remote Viewing.
Read the first 3 chapters FREE at www.ez3dbiz.com/arv.html
To use the Sun to work with the Dow Jones, we use what are termed "cross points". These are periods when the earth&Î39;s geomagnetic energy increases with a peak or low in the sun&Î39;s solar flux. When we identify these in advance, we than look at the magnetic activity on the earth, as well as additional space data to forecast what the Dow Jones position will be within the next few hours. Another group using solar and lunar data to forecast the dow is Time Price Research.
Additional Articles:
The Sun&Î39;s Energies And How They Affect The Dow Jones Industrial Average
How Human Consciousness is Stimulated by Our Sun
An excellent example of a cross point is the September 9-11 attacks. Let&Î39;s take a closer look. Below are the KP Values for this date. Data available at the KP Archive. A full analysis is also available here.
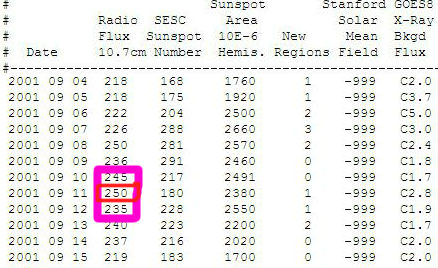
Now let&Î39;s take a look at the sun&Î39;s 10.7cm solar flux on this fateful day. As you can see below
the 10.7cm flux peaked at 250, than started dropping. This is our "cross point" date.
Energetic Peaks in Nature and Chemical Reactions
Energetic peaks have been shown to occur in the suns solar flux, causing major highs and lows in the stock market and 911 and Boston bombings as our reseach has shown. This means we have 3 layers of Peaks. Peaks of Sunspots, Peaks in the Suns Solar Flux and Peaks in earths Geomagnetic Activity. This article goes into more detail about these peaks. At these peaks is when major changes occur. It is like things speed up to this junction, than reverse themselves at these peaks.
These peaks can become amplified during super moon perigees, which have been shown to cause earthquakes and tsunamis.
Also we make the miracle healer Ormus by creating a peak in saltwater. This peak chemical reaction occurs when the salt water is made more alkaline. At this junction a peak is formed, that extracts the super healing elements from the salt water.
To predict these future cross points we use the 45 AP Forecast courtesy of the U.S. Airforce located at:
http://www.swpc.noaa.gov/ftpdir/latest/45DF.txt
We can also use the NOAA Outlook table located at:
http://www.swpc.noaa.gov/ftpdir/latest/27DO.txt
We can narrow down the future KP forecast, using the 3 day forecast located at:
http://www.swpc.noaa.gov/ftpdir/latest/geomag_forecast.txt
Historical KP Forecast Records:
http://www.swpc.noaa.gov/ftpdir/forecasts/45DF/
http://www.swpc.noaa.gov/ftpdir/forecasts/geomag_forecast/
http://www.swpc.noaa.gov/ftpdir/forecasts/three_day/
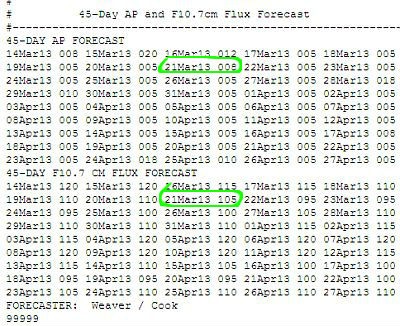
If we want to find the next "cross point", we can see that on March 21st, 2013, the Sun&Î39;s 10.7cm Solar Flux "Drops" to 105, and the AP levels (KP and AP are very similar, AP uses a more sensitive measurement of the KP values) "Jump" to 008, which is our next cross point day. Now these days are accurate to within 48 hours, so usually you will need to check them again, just before these dates.
Now this "cross point" can even include the solar flux rising and the KP levels dropping. It is only when they both occur around the same time that we have our cross point day. The interesting thing is about studying this data is if a cross point occurs over a weekend, the Dow Jones will usually close higher on Friday.
Now we need to look at the magnetic activity levels that earth will be experiencing on this date. So we gather this data and assign it numbers. We have assembled all this which you can use on this page. The early rough format is still available for viewing here. Dow Jones Cross point dates for 2012 are also available for research viewing on this page.
So that&Î39;s it. Something very special happens during these cross point dates. It is like a portal of some type opens up. By analysing the energies present, we can use it to create forecasts. So far I am at 80% accuracy with the Dow, but I will not post results until I acheive 100%.
In 2014 NASA is going to send a space probe to examine these portals in more detail.
View
http://www.nasa.gov/mission_pages/sunearth/news/mag-portals.html
to learn more.
Additional Resources:
Now and Futures.com
Thank You for visiting our site and reading our articles and new update. If this information has helped you or someone you know, please consider contributing to this site. Your contribution will ensure the continued publishing of unique and quality articles at no cost to all of our visitors and regular readers.