
Solar Flare Monitor
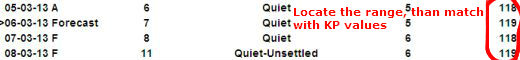
Real Time KP Levels
http://www.swpc.noaa.gov/rt_plots/kp_3d.html
Long Range Forecasting Tools Page
http://www.ez3dbiz.com/long_range_forecasting.html
DOW Toolbox Page
http://www.ez3dbiz.com/toolbox.html
Link Resources Page
http://www.ez3dbiz.com/time_travel.html
Project Dow Data Access Page
http://www.ez3dbiz.com/project_dow.html
Sensitive in order:
first day of longer waves - outweighs kp values
within 24 hrs of solar flux peaking - will boost rise results
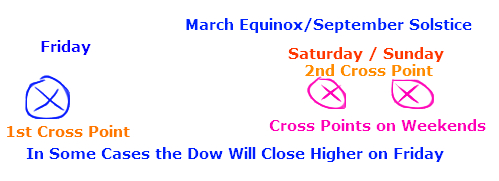
if the paramters (cross matching) occurs over a weekend, the following Monday, the dow will close higher, ignore previous monday model
if weeekend approaching and the waves do not show a rise over that period, but flux and kp match, than follow the weekend rule, where it rises on the following friday
within 24 hours of a flux cycle can be used to take measurements. eg; 2011 02 23 89 27 200 0 -999 B1.8 2011 02 24 89 23 260 1 -999 B2.6
if the waves are very strong before a Spring/Fall Equinox Cycle, these will take over priority of kp values if they are very low or have been dropping
SOLSTICES AND EQUINOXES - the first major rise in kp values
2011 02 27 1 0 0 0 0 1 1 0 0 1 0 0 0 0 2 0 0 0 2 1 0 0 0 1 1 0 1
2011 02 28 2 0 0 1 1 1 0 0 1 1 0 0 1 1 1 0 0 0 3 0 0 1 0 1 0 1 1
2011 03 01 18 2 2 3 3 4 4 4 3 53 1 2 3 5 6 6 5 7 31 2 2 2 4 5 6 5 4
2011 03 02 12 3 3 2 2 3 3 2 3 43 4 3 6 4 6 4 2 6 17 4 4 3 2 3 3 3 3
2011 03 03 11 3 2 3 2 3 2 2 3 23 3 2 4 4 5 4 3 3 12 2 2 4 2 3 2 3 3
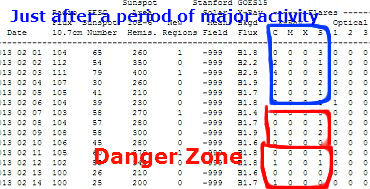
This energy is further accelerated by 4-8 sunspots (4 & 8 sunspots/optical will cause a rise also) or opticals and a leap in the solar wind - DO NOT TRADE UNTIL THE KP HAS REACHED ITS PEAK DURING THIS PERIOD> ONLY WHEN KP VALUES HAVE PEAKED WILL A RISE OCCUR
if the longer waves go over into the weekend, this can cause a rise also
if conditions are good, the 2nd day of longer waves will cause a rise
Solar Flux 3 day forecast
http://sidc.oma.be/current/meu.html
2nd 10.7cm Solar flux 3 day forecast
http://www.swpc.noaa.gov/ftpdir/latest/RSGA.txt
Sunspots and X-Ray Flux Data: http://www.swpc.noaa.gov/ftpdir/latest/DSD.txt
Real Time http://www.swpc.noaa.gov/rt_plots/xray_5m.html
SUMMARIZED 5 minute intervals - - - - - http://www.swpc.noaa.gov/ftpmenu/lists/xray.html
Last Few Days of Solar Flux Data http://www.swpc.noaa.gov/ftpdir/latest/DSD.txt
Solar Flux Forecasted Rise http://www.nwra.com/spawx/27do.html
2nd Solar Flux Forecast http://www.swpc.noaa.gov/ftpdir/latest/45DF.txt
3rd Solar Flux Forecast http://www.swpc.noaa.gov/ftpdir/latest/27DO.txt
Britsh Solar Flux Forecast - INCLUDES NEURAL NETWORK 3 DAY KP
PREDICTION FORECAST
http://www.geomag.bgs.ac.uk/data_service/space_weather/forecast.html
NOAA 27 Day AP and KP Forecast (The Planetary A Index
are Magnetogram Measurements )http://www.swpc.noaa.gov/ftpdir/latest/27DO.txt
Monthly Long term solar flux Forecast
http://www.swpc.noaa.gov/ftpdir/weekly/Predict.txt
-----------------------------------------------------------------------------------------------------------------------
KP Forecasting
Canadian Canada KP Forecast
http://www.spaceweather.gc.ca/current-actuelle/long/sflt-1-eng.php
Solar Cross Currents
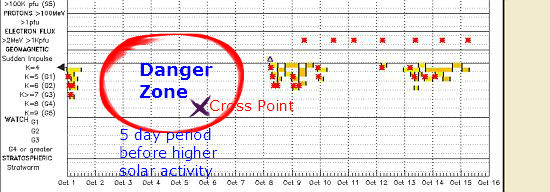
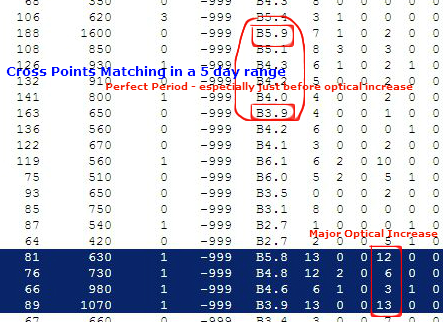
Leading up to a cross point between 24 and 72 hours, smaller periods lasting 3 days in length will show a peak or lowering of solar activity, along with an increase in KP activity. The 3 Day Solar Flux Forecast and the recent sunspot activity levels can be used to identify these. THIS WILL USUALLY COINCIDE WITH A PEAK IN KP LEVELS.
KP Levels FORECASTED Next Hour
http://aurora.fmi.fi/public_service/magforecast_en.html
KP Forecasting #2
http://spaceweather.ru/content/solar-wind-monitoring-and-short-term-geomagnetic-forecast
Britsh KP Forecast - INCLUDES NEURAL NETWORK 3 DAY KP
PREDICTION FORECAST
http://www.geomag.bgs.ac.uk/data_service/space_weather/forecast.html
Britsh KP Forecast http://www.geomag.bgs.ac.uk/data_service/space_weather/forecast.html
Kp 3 day forecast
http://www.spaceweatherlive.com/en/auroral-activity/aurora-forecast
Dst, KP and AE indexes
http://mms.rice.edu/realtime/forecast.html
KP Forecast on bottom of this page
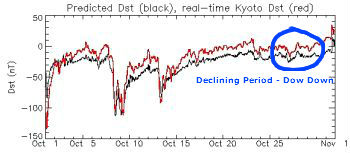
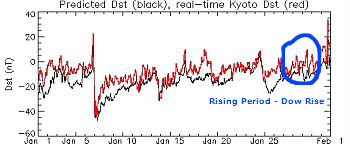
DST Values work well during the September period when the KP and AP values may not be as sensitive. Patterns include:
A larger dip in the line, the Dow Jones Industrial Average will decline with it.
A less dip in the line will usually show a rise in the Dow Jones Industrial Average.
DST Forecast:
http://www.iki.rssi.ru/apetruko/forecast/forecast.html
DST Prediction:
http://lasp.colorado.edu/space_weather/dsttemerin/dsttemerin.html
USGS Real Time DST
http://geomag.usgs.gov/realtime/dst/
DST 3
http://wdc.kugi.kyoto-u.ac.jp/dst_realtime/presentmonth/index.html
DST Archive:
http://lasp.colorado.edu/space_weather/dsttemerin/archive/dst_years.html
DST Archive #2
http://kogma.nict.go.jp/cgi-bin/qlae.cgi?l_mode=1
KP FORECAST VIA DST
http://lasp.colorado.edu/space_weather/dsttemerin/dsttemerin.html
Lund DST Forecast (top of page)
http://rwc.lund.irf.se/rwc/dst/last24h.phphp
DST Prediction #3
http://orion.ph.utexas.edu/~windmi/realtime/
Source #1 http://www.swpc.noaa.gov/ftpdir/latest/45DF.txt
KP Forecast for Higher Levels: http://www.nwra.com/spawx/27do.html
3 Day KP Forecast (changes daily) http://www.swpc.noaa.gov/ftpdir/latest/three_day_forecast.txt
Previous KP Levels Numerical: http://www.swpc.noaa.gov/ftpdir/indices/old_indices/
Previous KP Levels Graphical: http://www.swpc.noaa.gov/alerts/k-index.html
PREVIOUS KP LEVELS GRAPHICAL #2 - EXCELLENT FOR LOOKING AT HIGH KP STORMS PREVIOUSLY
http://www.swpc.noaa.gov/alerts/k-index.html
click on musical.gif - http://www-app3.gfz-potsdam.de/kp_index/quicklook.html
For Instruments (see below)
In some cases the GOES magnetometer will show disturbance before a Dow decline.
GOES Magnetometer - Except for the Sept Equinox period.
http://www.swpc.noaa.gov/rt_plots/mag_3d.html
Proton Levels
Real Time Proton Prediction:
http://www.spaceweather.eu/en/forecast/uma_sep
Real Time Proton Levels:
http://www.swpc.noaa.gov/rt_plots/pro_3d.html
Warehouse
http://www.swpc.noaa.gov/ftpmenu/warehouse/2013/2013_plots/proton.html
http://www.swpc.noaa.gov/ftpmenu/warehouse/2012/2012_plots/proton.html
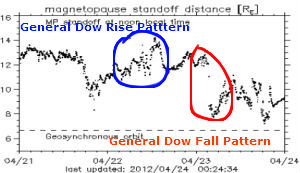
Except for during march, ocean Waves will show a negative rhythum for a dow fall
For a Dow rise the waves will show an off harmony rhythum
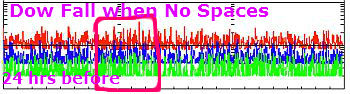
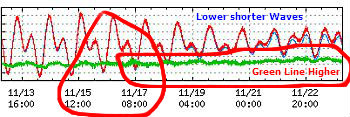
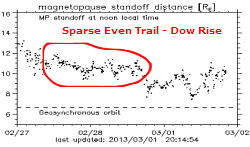
Dow Fall shown below: - GREEN LINE RISES
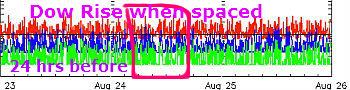
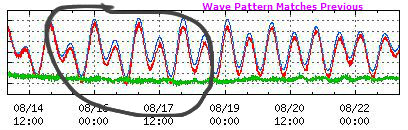
Dow Rise next 3 pics:
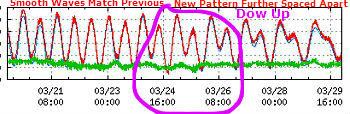
Dow Rise
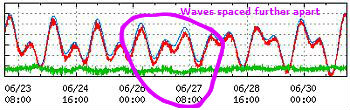
Dow Rise
Use Rome: http://neutronm.bartol.udel.edu/~pyle/Spectral.png
Rome Raw Data http://cr0.izmiran.rssi.ru/scripts/nm64queryD.dll/Rome?PD=1&title=Rome&
Thule Station: http://neutronm.bartol.udel.edu/realtime/thule.html
Long term cosmic ray rise - dow tends to rise
Shorter term cosmic rays rise or decline - dow tends to fall
Solar flux Activity Forecast can be used to roughly predict the rise and fall in cosmic rays .
COSMIC RAYS #1
http://ulysses.sr.unh.edu/NeutronMonitor/Misc/neutron2.html
IMF Data:
South Generally Higher Dow
When the IMF points south, the solar winds last longer and at higher speeds.
When the IMF is southward, antiparallel fields nearthemagnetospheric subsolar point allow merging between the IMF and geomagnetic fields. This process increases the transport of solar wind mass, momentum, and energy into the Earth's magnetosphere. This process can also open the magnetosphere to solar energetic particle radiation.
NOAA IMF real time and forecast
http://www.swpc.noaa.gov/ws/index.html
CURRENT IMF ANGLE
IMF REAL TIME
http://mms.rice.edu/realtime/dials.html
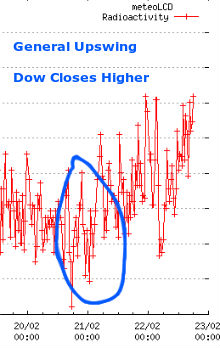
Dow Jones Closes Higher
Stronger dow overall from Nov to Feb
Just after a series of KP peaks
Strong magnomniter waves
Long term cosmic ray rise
Below are weaker wavess
http://sd-www.jhuapl.edu/
Below are Stronger Waves (best for higher close)
Dow Jones Closes Lower
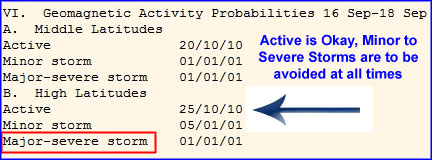
When KP levels are forecasted at severe (see image below)
Very short term cosmic ray rise
Stronger flares forecast ahead
Weaker than usual magntomiter waves
These can follow a cross match infiniti pattern based on the above values Declining or rising solar flux and cosmic rays
Just after a high KP cycle, when the KP is lower,
planetary influences can show themselves stronger, eclipses, such as the full moon, retrograde etc.
Survey of Professional Forecasters
http://iswa.ccmc.gsfc.nasa.gov/
Magnetosphere -- Button #3
At exactly midnight on the date, there will be a drop in the levels, in most cases between level 8 and level 10 or it will be in a decline, like the solar wind.
Drop in levels between midnight and next 4 hours day before.
MUCH LESS ACCURATE DURING SEPTEMBER SOLSTICE
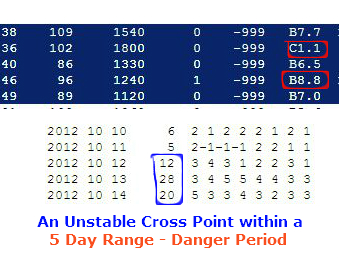
UNEVEN OR DISTURBED SOLAR FLUX CROSS POINT VALUES
Protons
48 TO 72 HRS BEFORE. THE RED LINE WILL SHOW AN INCREASE IN PROTONS
ACCESS PROTONS -- MULTIPLE READINGS CHART
Multiple redstars on nasdaq economic outlook
http://www.nasdaq.com/markets/us-economic-calendar.aspx
2013 Economic release dates
http://m.nber.org//releases/cal_by_title.txt
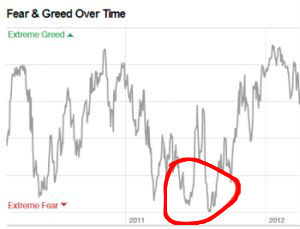
The Fear Index on a downward trend hitting new lows
http://money.cnn.com/data/fear-and-greed/
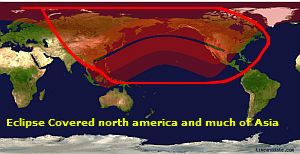
SOLAR ECLIPSES WITH THE SHADOW COVERING USA AND ASIA HAVE THE MOST IMPACT
upcoming solar eclipses with coverage area:
http://www.timeanddate.com/eclipse/
Next Eclipses:
April 25, 2013: Penumbral Lunar Eclipse
■May 9-10, 2013: Annular Solar Eclipse
■October 18/19, 2013: Penumbral Lunar Eclipse
■November 3, 2013: Total Solar Eclipse
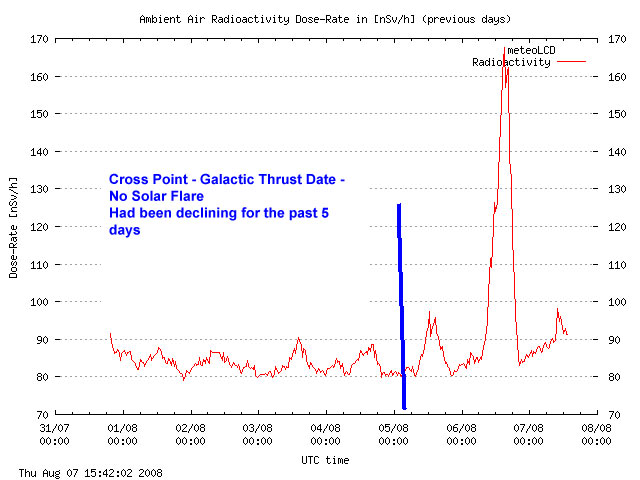
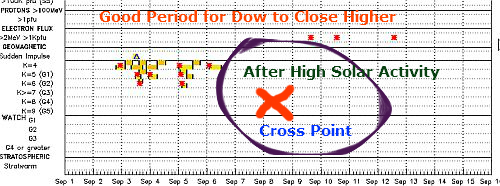
When a large number of flares have just occurred, at the cross point, after the peak in kp values, the first drop in kp values boosts the dow. Especially after the most active months from may to august.
For Long Term Drops in the Dow Jones Industrial Average that can last up to 2 weeks:
Start of Mercury Retrograde
http://www.findyourfate.com/astrology/year2013/2013-mercury-retrograde.html
Economic Report Indicators
****** Negative Jobs Report
****** Rising Unemployment
****** Manufaturing Contraction
****** Possible Higher Euro Unemployment
NASDAQ:
RED STARS BAD
GOLD STARS GOOD
http://www.nasdaq.com/markets/us-economic-calendar.aspx
Backup Link
http://www.bloomberg.com/markets/economic-calendar/
Yahoo Economic Calendar
http://biz.yahoo.com/c/ec/201309.html
Greed Index:
Dow Decline - More Fear
Dow Rise - More Greed
Access Greed Index:
http://money.cnn.com/data/fear-and-greed/
At the September Solstice, the Magnetometer waves will not show the same consistent pattern, so they must not be used during this period
Access Graph
RETROGRADES, ESPECIALLY JUST BEFORE AND AFTER AND AROUND CROSS POINTS
http://www.swpc.noaa.gov/forecast.html
Backup Link:
http://www.shaktitechnology.com/geomagnetic_forecast.htm
Cloud Cover Fraction Parameters:
These effects are minimal, but in most cases 24 hrs before a Dow rise, there will be sparse or 1/3 cloud cover over the united states. Access Cloud Cover Real Time Database
Issue a warning if solar eclipse with 11 day period before or after
Going from 1 solar flux peak to the next will ride out a bad cycle this bad cycle will be followed by a change in the ocean frequency waves
Future Downward Trends (SWITCH IN POLARITY):
an eclipse, bad saturn or MARS 19.5 degrees will cause the above positions that make it rise to instead fall
Saturn
Higher KP Values forecast over a weekend, will cause a rise on Friday or Thursday
Eclipses:
http://eclipse.gsfc.nasa.gov/eclipse.html
Planets position hunter
http://www.configurationhunter.com/astrology-tools/planet_positions
Future Planet Regrogrades;
http://www.cafeastrology.com/retrogrades.html
Mercury and Other Planet Regrogrades:
http://www.findyourfate.com/astrology/year2013/2013-mercury-retrograde.html
http://www.cafeastrology.com/astrologyof2013horoscopes.html
Lunar Cycles:
http://www.cafeastrology.com/lunarcyclesgraph.html
Many Details on one page:
http://astropixels.com/ephemeris/astrocal/astrocal2013gmt.html
Solar Eclipses - up to a week in advance
http://eclipse.gsfc.nasa.gov/SEdecade/SEdecade2011.html
Mercury/Jupiter Retrograde:
http://www.artcharts.com/calendar/retrograde_calendar.html
Saturn @ 10 degrees 38 minutes
Mars in Apogee or around 19.5 degrees
Mars at Apogee Calendar - Tue, 04 Jun 2013
http://serennu.com/astrology/aspects.php
----------------------------------------
GOOD PERIODS FOR DOW TO RISE INDICATORS:
Magnetosphere --
When the Dow Rises, in most cases, there will be higher level numbers, usually above 10 or more, and it will have less rises/falls or waves and will be more steady and spread out over a larger area.
Rise in levels between midnight and next 4 hours day before.
MUCH LESS ACCURATE DURING SEPTEMBER SOLSTICE
Database and real time:
http://pixie.spasci.com/DynMod/
When 2 cross points occur within a 5 day cycle with no forecast peaking optical or flares, this is a good cycle
Moon Perigee Calendar
http://www.fourmilab.ch/earthview/pacalc.html
Seasonal Houses: December equinox into March -
**************** Aries/ Gemini - Starts early - Cross point begins December 15th for Gemini
http://www.astroprofile.com/2013moonvoid.htm
Full Moons - Lower Dow
New Moons - Higher Dow
Know Condition Color
Holidays
Solar Eclipses
Planetary Danger Cycles
____________________________________________________________________________
Ocean Frequency Switch:
http://tidesandcurrents.noaa.gov/data_menu.shtml?bdate=20130211&edate=20130218&datum=6&unit=1&shift=g&stn=1615680+Kahului%2C+Kahului+Harbor%2C+HI&type=Tide+Data&format=View+Plot
Acclerators of Rise or Fall
Rising or Declining Trend Period of Sunspots, X-Ray Flux
Priming Phase - To Check Previously
Last 11 Days of Dow Jones or previous X-Ray Solar Flux Levels
X-Ray Flux Data: http://www.swpc.noaa.gov/ftpdir/latest/DSD.txt
Solar Flares Graphical: http://umtof.umd.edu/pm/flare/
Solar Flares Graphical #2: http://www.swpc.noaa.gov/alerts/archive.html
Solar Wind
Solar Wind Forecast
http://lasp.colorado.edu/space_weather/dsttemerin/dsttemerin.html
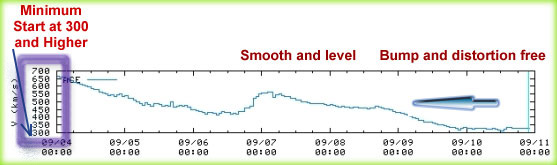
Real Time solar wind speed
Solar Wind Forecast
http://www.swpc.noaa.gov/ftpdir/latest/forecast_discussion.txt
Wind Density #2:
http://www.swpc.noaa.gov/ace/MAG_SWEPAM_24h.html
Solar Wind Density Future Plots
http://umtof.umd.edu/pm/FIGS.HTML
Solar Wind Forecast
http://www.ips.gov.au/Solar/1/5
Solar Wind Forecast
http://www.lmsal.com/forecast/wind.html
Solar Wind Jump dates
http://www.swpc.noaa.gov/ftpdir/weekly/WKHF.txt
Solar Wind Plasma from Flares Arrival Forecast up to 7 days in advance
http://iswa.gsfc.nasa.gov:8080/IswaSystemWebApp/index.jsp?i_1=141&l_1=40&t_1=270&w_1=600&h_1=500
Magnetometer
Going from small, short wavelengths to longer wavelengths. May change polarity for rise/fall around equinoxes, or solstices, especailly during December.
NOAA Goes Mag will show disurbance 24 hrs of either an up or down Dow Jones Industrial average ----
---- Except for the Sept Equinox period.
---- In some cases the magnetometer will show disturbance before a Dow decline.
GOES Magnetometer - Except for the Sept Equinox period.
http://www.swpc.noaa.gov/rt_plots/mag_3d.html
Database:
http://www.swpc.noaa.gov/ftpmenu/warehouse/2012/2012_plots/goeshp.html
Real Time East Coast Maryland
http://www.genesisobservatory.us/sam/Current%20Real-Time%20Magnetogram/
By Latitude:
http://www-ssc.igpp.ucla.edu/gem/worldmag/
http://www.spaceweatherlive.com/en/auroral-activity/magnetometers
By latitude:
http://www.sam-magnetometer.net/
Visual Reference by Geographic location with clickable access map
http://www.sam-magnetometer.net/map/index.html
Graphs
This Graph Is Good:
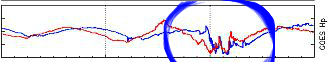
On this graph - after very solid non-active line, first sign of activity will reflect changes in values:
http://www.irf.se/Observatory/?link[Magnetometers]=Data/
This Graph is Good (with database) - Magnetosphere - button #6
http://iswa.gsfc.nasa.gov:8080/IswaSystemWebApp/index.jsp?i_1=141&l_1=40&t_1=270&w_1=600&h_1=500
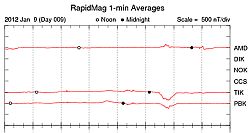
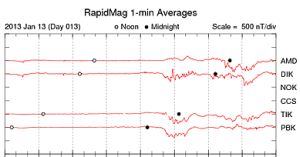
Best Database
http://sd-www.jhuapl.edu/rapidmag/
2nd Best Database
http://space.fmi.fi/image/jpg/
This Graph is Good (with database):
http://wdc.kugi.kyoto-u.ac.jp/ae_realtime/today/today.html
Magnetometer Future Plots:
Northwest Research Associates Geomagnetism Disturbances Forecast 20 days out:
http://www.nwra.com/spawx/ap.html
2nd Forecast
http://www.geomag.bgs.ac.uk/data_service/space_weather/forecast.html
By Clicking on the "X" Axis you will get a slight future change 4 hours ahead of time before major changes occur - cross ref with additional data to be sure:
http://www.geo.fmi.fi/image/beta/?page=last_30
2012 archive - http://www.geo.fmi.fi/image/prel/
This one may start to dislay a lighter blue shaded background before the energy starts to increase
http://space.augsburg.edu/maccs/browsespectrogram.jsp?station=CD&startYear=2013&startDay=17
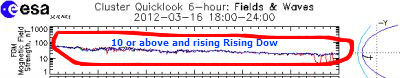
Magnetic Field Strength
For a dow rise. In general between 12pm and midnight the magnetic field strength levels will be beween 10 and 50 with a rising upwards trend......
For a dow drop.between the hours of 6am and 24:00 or midnight, the magnetic field strength generally will be beween 10 and below and showing a downwards, falling trend.

Magnetic Field Strength Archives:
Magnetosphere and Button #6
iswa.gsfc.nasa.gov/iswa/iSWA.html
http://www.cluster.rl.ac.uk/csdsweb-cgi/csdsweb_pick
http://www.cluster.rl.ac.uk/csdsweb-cgi/csdsweb_pick?P_
Earth's Magnetosphere
http://iswa.ccmc.gsfc.nasa.gov/
Magnetosphere -- Button #3 -
Sensitive Magnetogram
http://www.irf.se/Observatory/
Sensitive Magnetogram Real Time with Database
http://sd-www.jhuapl.edu/
This Graph is also very sensitive
http://space.augsburg.edu/maccs/browsegraph.jsp?station=CD&startYear=2013&startDay=43
This Graph is Very Sensitive and gives daily values: USE X Mark to locate date future benefiical disturbance signature
http://www.geo.fmi.fi/image/beta/?page=last_30
Matches this image:
This Graph is Good (with database) - Magnetosphere - button #6
http://iswa.gsfc.nasa.gov:8080/IswaSystemWebApp/index.jsp?i_1=141&l_1=40&t_1=270&w_1=600&h_1=500
Matches this image:
http://www.geo.fmi.fi/image/beta/?page=last_30
Database
http://space.fmi.fi/~hakkinel/image/?page=online
Real Time Multiple Graphs:
http://www.sam-magnetometer.net/
Databases:
http://wdc.kugi.kyoto-u.ac.jp/ae_realtime/lastday/lastday.html
Real Time Maryland East Coast:
http://www.genesisobservatory.us/sam/Current%20Real-Time%20Magnetogram/
For Longer Term Rises:
The dots on this page will change from a lighter color to a more intense color from the previous few days: http://farside.nso.edu/oQR/fqj/
For Longer Term Rises - The Bradley Sidegraph
To locate bradley sidegraph do google images search term for - Bradley Siderograph
Magnetic reconnection rotation - (Solar - Button #10)
http://iswa.gsfc.nasa.gov:8080/IswaSystemWebApp/index.jsp?i_1=141&l_1=40&t_1=270&w_1=600&h_1=500
1- The Earth must come from behind the sun after reemerging
2 - Going from South of Equator, heading back towards north east, at 19.5 degrees, upon entering this angle, rise in dow occurs.
3- Most interesting is making a 'U' turn going from the corner after heading west, and than back out to 19.5 degrees heading east
4 - Other patterns include directly 180 degrees opposite in the south west region following the same pattern as above
5- Another pattern is heading from the equator back towards the 19.5 degree tip/edge area
Downwards trend is when it is headed and settles directly in the center of the red latitude line
For the most accurate results, it is best to follow the previous 5 days pattern and see if the pattern above matches any of the above patterns to plot future forecasts
______________________________________________________________________
______________________________________________________________________
______________________________________________________________________
Misc:
Planets position hunter
http://www.configurationhunter.com/astrology-tools/planet_positions
Future Planet Regrogrades;
http://www.cafeastrology.com/retrogrades.html
Eclipses:
http://eclipse.gsfc.nasa.gov/eclipse.html
Lunar Cycles:
http://www.cafeastrology.com/lunarcyclesgraph.html
Additional Data:
http://www-app3.gfz-potsdam.de/kp_index/related.html
LINKS:
Hidden Portals in Earth's Magnetic Field
http://www.nasa.gov/mission_pages/sunearth/news/mag-portals.html
http://time-price-research-astrofin.blogspot.com/2012/07/spx-vs-sunspots-solar-flux.html
http://www.cxoadvisory.com/3942/calendar-effects/sunspot-cycle-and-stock-returns/
http://slopeofhope.com/cycles/page/2/
--------------------------------------------------------------------------------------------------------
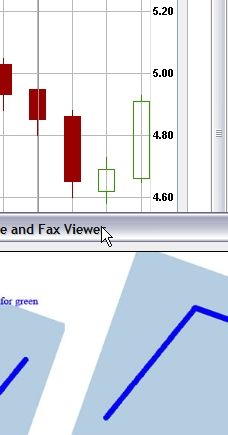
Locate the ones in green with highest rising sectors in green and make a note of at least 7 minimum
http://barchart.com/stocks/sectors/
If bar chart goes down, use this as a backup:
http://biz.yahoo.com/ic/l/pip.html
STEP 2 COMPARE THE STOCKS THAT ARE IN THE GREEN TO THE OVERALL DOW JONES RISE.
VOLUME AT 700,000 WEEKLY FOR MINIMUM VOLUME
Go here:
http://finance.yahoo.com/echarts
http://finance.yahoo.com/echarts?s=DHI
and compare against the DOW symbol in 1 MONTH, DAILY, - THINK OF THE DOW AS THE HUGE GEAR WHEEL THAT WITH ITS MASSIVE DENSITY, "PUSHES" SMALLER STOCK FORWARD, SO ONLY A SMALL RISE IN TEH DOW WILL PUSH THE SMALLER STOCKS FORWARD
Look for these attributes:
* : The further below the dow jones line the better
* : Almost even and along with the dow jones line\
Always use the chart during the last 4 days when the dow last rose to "scale" and find the patterns
STEP 3 - CHECK FOR VOTALITY BY LOOKING FOR REPORT RELEASES:
Usually a few days before a major report is released, votality is more powerful. This occurs in the mornings.
Economic Calendar:
http://biz.yahoo.com/c/ec/200838.html
Check for any earnings releases on the Forecasted Rise Date - this can cause a decline
Earnings Calendar:
http://biz.yahoo.com/research/earncal/today.html
4: FINAL
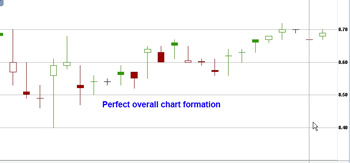
Check that the day before the prediction that the volume closes up higher and it has the following pattern below
Must have risen above previous high WITH LOTS OF VOLUME PRESENT as shown in the photo below(Candlestick View
Chose 5 days 15 minute Candle stick View (CAN BE USED TO COMPARE WITH DOW ALSO)
http://bigcharts.marketwatch.com/
http://www.dailyfinance.com/stock-charts/
Hot Stocks:
These picks below must match green sector and match rise and fall with dow
http://www.barchart.com/stocks/hotstocks
http://www.barchart.com/blog/index.php?blog_id
http://investorplace.com/stock-picks/
http://money.msn.com/investing/stockscouter-stock-category.aspx
Online Charting Programs:
http://stockcharts.com/freecharts/candleglance.html?ROCK
------------------------------------------------------------------------------------------
Companies that make up the DOW:
http://nyjobsource.com/djia.html
STOCK MAKET HOLIDAYS
http://www.rightline.net/calendar/market-holidays.html
------------------------------------------------------------------------------------------
Galactic Center is currently at Sagittarius 26 degrees, 57 minutes and 57 seconds headed towards 28 degrees
Going from 14 into 15 degrees - researching more (thrust)