

Wormhole Theories, Sunspot Activity and Remote Viewing Stocks
View Chapters
 Read the first 3 Chapters Free
Visit the 3 Part Remote Viewing Series Library of Books
March 3rd, 2016:
The forecast was for the dow jones to close 120 points lower. However the dow closed up 40 points, however for most of the day it was trading lower. Most ARV sessions are usually correct until the last 2 hours when market votality can be stronger. We have seen this pattern occur in numerous sesions where in some cases about 2 hours before closing the activity will suddenly show an increase or decrease.
Because February is a season of ARV accuracy, starting next week (Feb 15th, 2016) for the next 2 months we will be doing ARV sessions at apogee moons at local high tide. If cosmic days are in decline and Fredericksburg is below 7 we should have some very accurate arv sessions.
DUE TO THE UNPREDICTIBILITY AND STILL CURRENT PRIMITIVE SOLAR WEATHER FORECASTING TECHNOLOGIES, PLEASE CHECK THIS PAGE EVERY 2 DAYS FOR ANY CHANGES TO THE DATE OF THE DOW JONES ARV FORECASTS
(as technology for solar weather forecasting continues to improve, so will the timelines/dates of our ARV sessions)ARV results were for the dow to show stronger trading throughout the day closing slightly lower between 20 and 30 points on Monday FEB 22nd, 2016. On Tuesday Feb 23rd, 2016, the dow closed lower. Trading throughout the day was higher overall with no decline. The dow closed up over 300 points.
KEY ENVIRONMENTAL POINTS FOR ASSOCIATIVE REMOTE VIEWING
Decline in cosmic rays
Conducting ARV sessions at 13:30 LST Time
River or Ocean Tide going from low to high
Apogee moon
Middle Latitude Fredericksburg K-indices
ftp://ftp.swpc.noaa.gov/pub/indices/old_indices/2016Q1_DGD.txt
The REMOTE VIEWING RESULTS FOR THE DOW JONES CAN BE FOUND BY FOLLOWING THE INSTRUCTIONS BELOW:
Please note as of January 2016, this is a BETA testing site only. We strongly do not recommend that you trade the markets using this future information until this system is 100% perfected. The Dow Jones ARV forecast is based on the research gleaned from our 2015 testing.
The next future position of the Dow Jones industrial average can be accessed by calling the following phone number and following the instructions below:
Call: (641) 715-3900
Enter Extension: 581881
Listen for the recording.
So by using the calculations at apogee moon with the tide in our local region going from low to high at the halfway mark we can plot the following windows using our location -
The 13:30 LST times converted to Pacific Standard Time are as follows -
FEB 15th, - 4 am
FEB 27th, - 3 am
March 25th - 1:30 am
Therefore the best time for ARV on FEB 19th, 2016 is 2:30 am because 13:30 LST occurs at 4;00 am and the halfway point between local low and high tide is 2:30 am.
The times don&¦39;t have to perfectly match but can be within a 4 hour window of the 13:30 LST time, as long as the geomagnetic activity is at quiet levels and other favorable solar weather conditions are occurring.
The next window for the march apogee moon is around 11:30 pm on march 3rd, 2016 at. On march 4th, 2016 we get 12 am and on march 5th, 2016 we get 1:15 am and on march 6th, 2016 we get 2 am
The next apogee moon is late march on march 25th, 2016 with a 13:30 LST at 1:30 am Pacific Standard Time. This gives us ARV windows on 3-29-2016 at 10:30 pm and on 3-30-2016 at 11:30 pm
Because FEB is a season ARV peaks the times for this weeks arc session are as follows -
FEB 17th, 2016 - 12:30 am
FEB 18th, 2016 - 1:30 am
FEB 19th, 2016 - 2:30 am
Between February 20th and February 21st, 2016 will be the date of the next ARV Dow Jones forecast. This is a period of apogee moon and
perfect gravity waves in the ARV location.
________________________________________________________________________________
_________________________________________
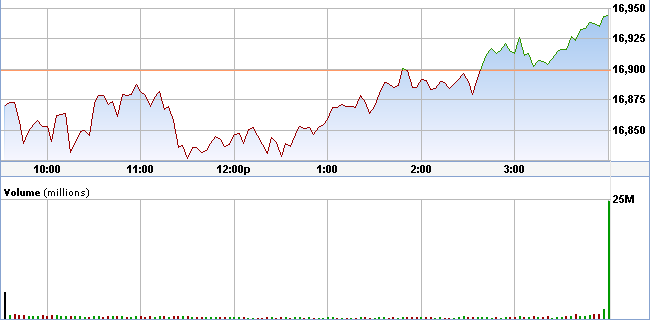
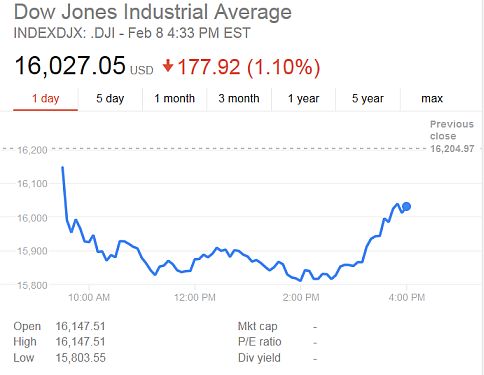
While solar and weather conditions were not optimal, an ARV session was conducted on Saturday February 6th at 3:00 a.m. The results were for a lower dow on Monday February 8th, 2016. Please note this ARV session was done using newer sensitive equipment. So we will see if this new equipment can overtake the un-optimal terrestrial and solar weather conditions.
Results for the forecast of the dow jones on Monday February 8th, 2016.
For this forecast we used the red-shift in cosmic rays, combined with the frequency of the river/ocean tide going from low to high, along with the peak infrared positions in the sky. This all cumulated to 3 a.m. Pacific Coast Time on Saturday February 6th, 2016. The new sensitive instruments helped boost this signal. The most relevant part however is we are at the ARV yearly seasonal peak which is the month of February in North America. Below is the image for the Dow Jones on February 8th, 2016. Middle Latitude Fredericksburg K-indices were below 7 (optimal).
_________________________________________
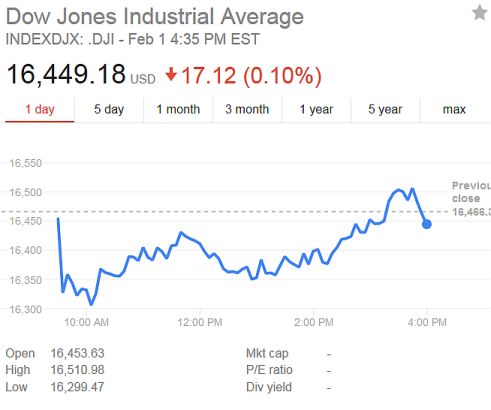
The Saturday evening January 30th, 2016, ARV session revealed for the Dow Jones Industrial Average to close between 40 and 120 points lower on Monday February 1st, 2016.
Results - On Monday Feb 1st, 2016, the dow jones closed down -7.12 (0.10%)
Because certain condition periods cause human consciousness to become stimulated, such as condition orange, blue and yellow, this same stimulation is reflected in the Dow Jones Industrial Average, which is made up of a selected number of top performing companies.
New Breakthrough Article Published August 4th, 2012, showing How the Dow Jones Rises EXACTLY according to certain energy window periods of our Sun. Complete Scientific Research Results Included. View Research Article Here
Because condition oranges cause mental instability and erratic behavior, we see this reflected as a drop in the Dow Jones, because condition blues and yellows cause a simulative effect, this is reflected in a rise in the Dow Jones Industrial Average. I had done intensive research on this years ago, and plotted the condition yellow periods as the best times to trade, however, now I am able to more accurately plot the data to give more refined predictions. In some cases 3 or more days of a Condition Green will make the Dow Rise also, but that is harder to predict. Condition Greens and Reds don&¦39;t seem to have much as an effect.
Additional Articles:
Using Portals in the Sun to Forecast the Dow Jones Industrial Average
How Human Consciousness is Stimulated by Our Sun
Please note if you are using the condition colors to look for when the Dow Jones rises (closes higher at the end of the day), 90% or more of the time it will rise at the very start of the condition blue. After that the "charge" has died down. So if there was a condition blue on a weekend, and the condition blue lasts until Monday, the effects may not be as strong, compared to the start of a condition blue on a weekday such as Thursday.
This non-rising of the Dow Jones is due to the "emotional motivational charge" having dissipated over the weekend, therefore it will not continue on onto the following Monday. As stated on this page, the Dow Jones will in most cases close higher at the very start of a condition blue. Condition blues almost always begin at the very end of a condition purple.
One of the most interesting observations to date is that from late November to early March
because more condition purples are occurring (less sunspots and solar activity) that predicting the Dow Closing higher at end of the day is much more accurate, compared to spring and summer when the suns activity is much more active. This is because the sudden unexpected "jolt" of solar activity occurring out of a condition purple is what influences the Dow Jones closing average. The Dow is most sensitive to these recent surges of solar activity. Compared to Spring and Summer, when the suns activity is much more active and condition purples are much more rarer.
All Forecasts are analyzed using our special Data Forecasting Page
So let&¦39;s look at the research from the EZ3DBIZ.com Solar Archives Page
All chart analysis is courtesy of E-trade
To Predict When the Dow Will Rise, here are the Latest Condition Blue and Yellow Periods>
On August 2nd, 2012 The Solar Health Condition was 100% Yellow towards late afternoon - On the afternoon of August 2nd the Dow Closed at 12,879. On August 3rd, the Dow Closed at 13,096 with a "breakout" rise occuring as soon as the markets opened.
On July 25th, 2012 The Solar Health Condition was 80% Blue 20% Orange - On July 25th, 2012, the Dow Closed at 12,696. On July 27th, 2012, the Dow Closed At 13,076
On July 16th, 2012 The Solar Health Condition was 50% Yellow and 50% Green - On July 16th, 2012, the Dow Closed at 12,727. On July 19th, 2012, the Dow Closed At 12,943
On July 11th, 2012 The Solar Health Condition was 100% Yellow - On July 11th, 2012, the Dow Closed at 12,605. On July 19th, 2012, the Dow Closed At 12,943. This overlapped from the 16th, resulting in a "superhigh".
On June 28th, 2012 The Solar Health Condition was - 70% Blue and 30% Orange - On June 28th, 2012 , the Dow Closed at 12,602. On July 3rd, 2012, the Dow Closed At 12,944
On June 16th, 2012 The Solar Health Condition was - 70% Yellow and 30% Orange - On June 15th, 2012, the Dow Closed at 12,767. On June 19th, 2012, the Dow Closed At 12,824
--------------------------------------
Now let&¦39;s take a look at the latest Condition Orange Periods.
On June 17th, 2012 The Solar Health Condition was - 70% Orange and 30% Red - On June 17th, 2012, the Dow Closed at 12,806. On July 24th, 2012, the Dow Closed At 12,617. Decline Began on July 19th.
On July 2nd, 2012 The Solar Health Condition was - 70% Orange and 30% Red. - On July 2nd, 2012, the Dow Closed at 12,871. On July 12th, 2012, the Dow Closed At 12,573. Decline Began July 5th.
On July 14th, 2012 The Solar Health Condition was 70% Orange and 30% Green - On July 16th, 2012, the Dow Closed at 12,976. On July 16th, 2012, the Dow Closed At 12,727. Decline Began July 16th due to Weekend.
On July 31st, 2012 The Solar Health Condition was 25% Blue and 25% Red and and 50% Orange - On July 31st, 2012, the Dow Closed at 13,009. On July 31st, 2012, the Dow Closed At 12,879. Decline Began July July 31st.
So in conclusion we can see an overall rise in the Dow at blue and yellow periods and a general decline during condition orange periods. If you look closely you will find that the mass collective human consciousness energy manifests differently at different periods. For a rise in the Dow Jones, the effects mannifest themselves within the first 24hrs of condition yellows and condition blues. For a drop in the Dow Jones, the effects don't begin until after approximately 72 hours into a condition orange period. Usually the condition Orange starts small, when it goes beyond 50%, it starts to affect the Dow Jones resulting in a drop. The sun is not the only body that affects human behavior, at this site it shows research showing that a full moon will lower the Dow Jones and a new moon will raise the Dow Jones on average. This research is published by Randall Ashbourne and is titled The Moods of the Moon.
Another research paper found the following: "In 2005 Yuan, Zheng, and Zhu found that stock returns are lower on the days around a full moon than on the days around a new moon. The magnitude of the return difference is 3% to 5% per annum based on analyses of two global portfolios: one equal-weighted and the other value-weighted. Whether this is a lunar effect remains to be seen."
Reference Source
So why does the Dow Jones rise when there are no C Class Flares?
From February 14th to March 26th, 2010, there were almost no C Class Flares counted. So what made the Dow Jones Rise non-stop From Mar 24th, 2010 until March 30th?. Well we look at the sunspots to find why this occurred. As we know from our research that condition blues will make the Dow Jones rise.
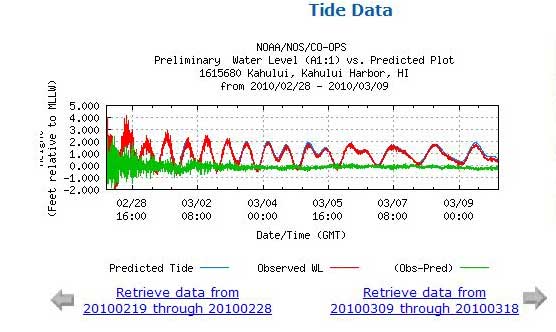 So on March 3rd, 2010, when this "break" on the dow occurred, the sunspot number increased from 39 to 40 with a 1 C Class Flare on the 4th. From March 5th to March 8th, 2010, the sunspots dropped from 35 to zero for 3 days, which also occurred over the weekend. There was also a change in the ocean tidal wave frequency. The Dow dropped from March 5th to March 8th.
 The next rise in Sunspot Activity occurred on March 10th, and the sunspots peaked on March 14th, with 1 C Class Solar Flare. The Dow followed the same pattern, rising consecutively until dropping on March 18th. So we can see that when the sunspot numbers are lower, and then the condition blue takes effect, this energy returns stronger than before, causing a major rise in the Dow Jones that follows.
I believe that these "Infrasonic" waves are affecting a part of human consciousness, causing a change in not only humans, but the entire earth as well. Here is an article on Ifrasound: Earth’s hum turns out to be just one of the many enigmatic signals resonating in the range known as infrasound. Broadly defined as sound waves longer than 56 feet, infrasound lies below the rumbling 20-hertz bass notes at the threshold of human hearing. Hurricanes, tsunamis, and tornadoes also generate their own characteristic low-frequency noise. Scientists are now studying infrasound to learn more about those powerful natural events and how to predict them—a skill that certain animals may already have. In fact, some animals generate their own ultrabass tones for a unique type of long-distance communication.
Source: Discover Magazine
Borderlands Reserach
While the inner hair cells (IHC), which mediate hearing, are insensitive to infrasound, the outer hair cells (OHC) are stimulated by it. There may also be a number of mechanisms that actively eliminate infrasounds from conscious hearing.
When there is a change in the Ocean Tidal Frequency, there is a shift in the infrasonic wave vibrations. This can be felt by people, as well as animals. Animals can tell whether or not this frequency means danger or not.
What Is a Natural Source of Infrasonic Waves?
The ocean is one of the biggest natural generators of infrasound, according to Milton Garces of the University of Hawaii, Manoa. Source: EHOW.com
Infrasonic waves are also called, Microbaroms, which are regular pressure variations of a few microbars (dyn cm−2) produced by the passage of infrasound (5 see period) radiated from ocean waves
Source: Amestoc
Under proper conditions and using the correct equipment and setup, ( full sound scale speakers, including infrasound ) in an enclosed, hall type setting or room, infrasound frequencies can be directed to affect humans physiologically, and will affect / direct brainwave activity and brainwave states, physical / bodily functions, and produce various physical and sensory response.
Source: Naked Science
A change in the ocean's tidal wave frequency causes behavioral changes in a large scale region of populated people. It also affects wide regions of the earth, from animals to plants and insects. Therefore if this energy is entering our consciousness from an exterior point, there must be some way that this energy can be projected outwards. This is where The Sonic Weapon of Vladimir Gavreau comes from. There is also this excellent research article showing that a Bigfoot Entity is using infrasonic waves to stay "invisible" and cloak himself using infrasonic waves. Perhaps the surrounding forest environment, of which this entity is in harmony with is also assisting in the infrasonic waves to help keep it hidden from physical view.
Infrasonic waves can come from the ocean, as well as from large tropical storms, volcanoes, earthquakes, black holes and meteorites. The further out into space you get, the longer and more deeper these infrasonic waves pulsate. I believe these infrasonic waves travel along the ley lines assisting or riding along the waves of telluric energy and exit outwards at certain points called platonic grid points. The 2 most powerful platonic grid points on earth are located in Paris, France and Hawaii.
Click the picture on the left to view real time values of these changing tides, as well as future predictions of frequency "shifts". Because one of these grid points is located in Hawaii, when this energy exits we can watch it as a change in the tidal wave frequency. This change in ocean frequency is what is responsible for a change in the condition colors, moving from one phase to the next, as well as changes in the stock market, and violent mood and behaviour swings.
Infrasonic waves have been shown to affect the pituary / pineal glands of our brains. This small pine cone shaped organ acts as a receiver and transmitter, which is like an antenna in our bodies.
References:
Using Infrasound to Listen to the Earth Breathing by Lorella Abenavoli - View Article
Ocean circulation generated magnetic signals
5NOAA’s National Geophysical Data Center, Boulder, U.S.A. - View Research Paper
Electromagnetic Ocean Effects National Geophysical Data Center NOAA - View Research Paper
Low Latitude infrasonics associated with geomagnetic activity
Geophysical Journal of the Royal Astronomical Society - View Research Paper
Explaining Ghost Sightings (Part 4 – Infrasound)
War for Science - View Research Paper
Other Infrasonic Source References:
Infrasound Laboratory, University of Hawaii, Manoa. View Site
Solar and Lunar Tides by GS Journal. View Site
Science and the Sea. View Site
INFRASOUND AND THE INFRASONIC MONITORING OF ATMOSPHERIC NUCLEAR EXPLOSIONS. View Site
Infrasonic Sound Simplified. View Site
View Reference Source
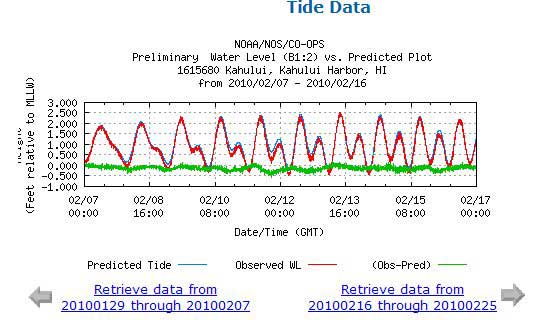 Okay, so let&¦39;s pick another date during a low sunspot cycle, when there are fewer C Class Solar Flares, say between February 12th and 13th. . As the image shows on the left, the ocean tidal frequency also changed, which we shall go more into about later on. As we can see this caused the Dow Jones to Rise consecutively from February 12th to February 19th, 2010. So it seems that during lower sunspot periods, when there are between 4 and 8 C Class Flares, the energy returns stronger, because it has not been experienced for a while.
Therefore there must be some type of evolution occurring during this condition yellow period. So where would we look for this evolution energy to manifest itself?, the ocean of course, which has evolved many species over millions of years.
The reason I choose Hawaii to view the changes in the tidal frequency is because it sits on a Platonic Earth Grid Point. I believe that as this energy manifests, just like a release of energy from an earthquake causes the plates to shift. it comes through at these points, changing or altering our consciousness, which than affects social and biological systems on earth. You can learn more about these grid points at Montalk.net or by viewing page 21 of the Becker-Hagens Planetary Grid System Coordinates article.
So let&¦39;s take a look at the wave frequencies for these periods:
Data Courtesy of NOAA:
March 20th 2010, Ocean Tidal waveforms
March 3rd 2010, Ocean Tidal waveforms
February 12th, 2010, Ocean Tidal waveforms
Archives Courtesy of NOAA
http://www.swpc.noaa.gov/ftpdir/indices/old_indices/
The Ocean Tidal Waveform is the "jump" in evolution. Everytime the Dow Jones rises during the condition yellow period, the Ocean Tidal Wave Frequency Waveform will always reflect this new "jump". I also show this same effect at the How Excessive Geomagnetic Energy Causes Psychological Outbreaks of Violence Research Article
The Secret to Time Travel - Using Your Mind as a Time Machine by Anthony Hamilton
Thank You for reading this article. If this or any other article has helped you or someone you know, please consider contributing to this site. Your contribution will ensure the continued publishing of unique and quality articles at no cost to all of our visitors and regular readers.