

Wormhole Theories, Sunspot Activity and Remote Viewing Stocks
View Chapters
 Read the first 3 Chapters Free
The Human Consciousness Collective becomes stimulated at certain periods when the sun's energy is at a precise point. This "window" of stimulation is when there are between 4 and 8 C Class Solar Flares. As we can see this has been hidden in various religions throughout history. I had found it interesting during my research that the catholic church has been monitoring solar activity for quite some time. We even have a day of the week called SUNday. Which is the day people go to church. This is not the only reilgion interested in the amount of energy our sun puts out. Here is a page showing the same symbols of the suns wheels. There is always between 4 and 8 "spokes" representing the number of between 4 and 8 C Class Solar Flares. So where do we see this stimulation reflected the strongest? In the stock market of course. This is where huge amounts of mental activity are taking place on a daily basis.
Additional Articles:
Using Portals in the Sun to Forecast the Dow Jones Industrial Average
The Sun's Energies And How They Affect The Dow Jones Industrial Average
A good visible example of how this is occuring is the rising of the Dow Jones. In this article we show how it is done, and how the Dow Jones can be predicted to rise in the future. Another example is mass violence or outbreaks of mental instability, which this research article goes into more detail about.
All Forecasts are analyzed using our special Data Forecasting Page
There are 3 requirements required for this "stimulation" period to take effect. On ez3dbiz.com, we call it the Condition Yellow Period. The requirements are:
Exactly between 4 and 8 C Class Solar Flares
A rise or "spike" in the KP index
A rise or "spike" in the solar wind speed
Usually when the solar wind "spikes", the KP index will do the same at the same time. When these both spike at the same time and there are between 4 and 8 C Class Solar Flares, the Dow Jones will rise. You will discover that the KP values will reach a peak or high during this "stimulation" phase period. For example, the KP values may start at 4 and than gradually rise to a peak of 12, then decline. It is at this peak, that the solar wind jumps and the stimulation takes place. So let's take a look at the Dow Jones during 2011, when there were exactly between 4 and 8 C Class Solar Flares.
You will always find a "change" in the frequency, just before the Dow Jones Industrial Average Rises. In most cases the red waveform will have "doubled", or show a smaller wave form halfway with a larger waveform in the overall pattern.
As an example from Feb 15th to Feb 18th, 2011 there was a long consecutive rise in the Dow Jones, which began on the 15th. As you can see in the tidal wave ocean frequency there was a major change in frequency on the 14th of February.
When there is a change in the Ocean Tidal Frequency, there is a shift in the infrasonic wave vibrations. This can be felt by people, as well as animals. Animals can tell whether or not this frequency means danger or not.
What Is a Natural Source of Infrasonic Waves?
The ocean is one of the biggest natural generators of infrasound, according to Milton Garces of the University of Hawaii, Manoa. Source: EHOW.com
Infrasonic waves are also called, Microbaroms, which are regular pressure variations of a few microbars (dyn cm−2) produced by the passage of infrasound (5 see period) radiated from ocean waves
Source: Amestoc
Under proper conditions and using the correct equipment and setup, ( full sound scale speakers, including infrasound ) in an enclosed, hall type setting or room, infrasound frequencies can be directed to affect humans physiologically, and will affect / direct brainwave activity and brainwave states, physical / bodily functions, and produce various physical and sensory response.
Source: Naked Science
A change in the ocean's tidal wave frequency causes behavioral changes in a large scale region of populated people. It also affects wide regions of the earth, from animals to plants and insects. Therefore if this energy is entering our consciousness from an exterior point, there must be some way that this energy can be projected outwards. This is where The Sonic Weapon of Vladimir Gavreau comes from. There is also this excellent research article showing that a Bigfoot Entity is using infrasonic waves to stay "invisible" and cloak himself using infrasonic waves. Perhaps the surrounding forest environment, of which this entity is in harmony with is also assisting in the infrasonic waves to help keep it hidden from physical view.
Infrasonic waves can come from the ocean, as well as from large tropical storms, volcanoes, earthquakes, black holes and meteorites. The further out into space you get, the longer and more deeper these infrasonic waves pulsate. I believe these infrasonic waves travel along the ley lines assisting or riding along the waves of telluric energy and exit outwards at certain points called platonic grid points. The 2 most powerful platonic grid points on earth are located in Paris, France and Hawaii.
 Click the picture on the left to view real time values of these changing tides, as well as future predictions of frequency "shifts". Because one of these grid points is located in Hawaii, when this energy exits we can watch it as a change in the tidal wave frequency. This change in ocean frequency is what is responsible for a change in the condition colors, moving from one phase to the next, as well as changes in the stock market, and violent mood and behaviour swings.
Infrasonic waves have been shown to affect the pituary / pineal glands of our brains. This small pine cone shaped organ acts as a receiver and transmitter, which is like an antenna in our bodies.
References:
Using Infrasound to Listen to the Earth Breathing by Lorella Abenavoli - View Article
Ocean circulation generated magnetic signals
5NOAA’s National Geophysical Data Center, Boulder, U.S.A. - View Research Paper
Electromagnetic Ocean Effects National Geophysical Data Center NOAA - View Research Paper
Low Latitude infrasonics associated with geomagnetic activity
Geophysical Journal of the Royal Astronomical Society - View Research Paper
Explaining Ghost Sightings (Part 4 – Infrasound)
War for Science - View Research Paper
Other Infrasonic Source References:
Infrasound Laboratory, University of Hawaii, Manoa. View Site
Solar and Lunar Tides by GS Journal. View Site
Science and the Sea. View Site
INFRASOUND AND THE INFRASONIC MONITORING OF ATMOSPHERIC NUCLEAR EXPLOSIONS. View Site
Infrasonic Sound Simplified. View Site
As stated earlier, the reason I choose Hawaii to view the changes in the tidal frequency is because it sits on a Platonic Earth Grid Point. I believe that as this energy manifests, just like a release of energy from an earthquake causes the plates to shift. it comes through at these points, changing or altering our consciousness, which than affects social and biological systems on earth. You can learn more about these grid points at Montalk.net or by viewing page 21 of the Becker-Hagens Planetary Grid System Coordinates article.
The next long rise began on March 22nd and ended on April 4th, 2011, and once again in the tidal wave ocean frequency, there was a major change in frequency on the 21st.
Once the ocean frequency has "changed", the Dow Jones will usaully follow thereafter, as there are between 4 and 8 C Class Solar Flares, or if we are in a low sunspot cycle, if the sunspot number is rising, especially when it reaches above 80 and again at 160.
2011 Research Results. Dow Jones Numbers were obtained by using the Daily Dow Jones Line Chart Courtesy of E-Trade.com
Feb 10th to Feb 11th - Dow Jones Consecutively Rose. Kp Levels. Solar Wind Speeds. C Class Solar Flare Numbers.
Feb 10th to Feb 11th - Ocean Tidal Wave Frequency
Feb 15th to Feb 17th - Dow Jones Consecutively Rose. Kp Levels. Solar Wind Speeds C Class Solar Flare Numbers.
Feb 15th to Feb 17th - Ocean Tidal Wave Frequency
On the left, I have included a snapshot of the change in ocean tidal frequency. March 1st to March 3rd - Dow Jones Consecutively Rose. Kp Levels. Solar Wind Speeds. C Class Solar Flare Numbers.
March 1st to March 3rd - Ocean Tidal Wave Frequency
March 22nd to April 4th - Dow Jones Consecutively Rose. Kp Levels March Kp Levels April Solar Wind Speeds. C Class Solar Flare Numbers.
March 22nd to April 4th - Ocean Tidal Wave Frequency
April 12th to April 15th - Dow Jones Consecutively Rose. Kp Levels. Solar Wind Speeds. C Class Solar Flare Numbers.
April 12th to April 15th - Ocean Tidal Wave Frequency
April 21st to May 2nd - Dow Jones Consecutively Rose. Kp Levels. Solar Wind Speeds. C Class Solar Flare Numbers.
April 21st to May 2nd - Ocean Tidal Wave Frequency
April 30th was on a Holiday. If this was a weekday, the Dow Jones most likely would have consecutively rose on this date. Kp Levels. Solar Wind Speeds. C Class Solar Flare Numbers.
May 27th to May 31st - Dow Jones Consecutively Rose. Kp Levels. Solar Wind Speeds. C Class Solar Flare Numbers.
May 27th to May 31st - Ocean Tidal Wave Frequency
June 16th to June 21st - Dow Jones Consecutively Rose. Kp Levels. Solar Wind Speeds. C Class Solar Flare Numbers.
June 16th to June 21st - Ocean Tidal Wave Frequency
August 5th was a Friday, the condition yellow did not occur until late afternoon. From Monday August 8th until Tuesday August 9th - Dow Jones Consecutively Rose. Kp Levels. Solar Wind Speeds. C Class Solar Flare Numbers.
August 16th to August 17th - Dow Jones Consecutively Rose. Kp Levels. Solar Wind Speeds. C Class Solar Flare Numbers.
August 16th to August 17th - Ocean Tidal Wave Frequency
August 29th to August 31st - Dow Jones Consecutively Rose. Kp Levels. Solar Wind Speeds. C Class Solar Flare Numbers.
August 29th to August 31st - Ocean Tidal Wave Frequency
September 11th was a weekend. From September 12th to September 16th - Dow Jones Consecutively Rose. Kp Levels. Solar Wind Speeds. C Class Solar Flare Numbers.
September 19th to September 20th - Dow Jones Consecutively Rose. Kp Levels. Solar Wind Speeds. C Class Solar Flare Numbers.
September 19th to September 20th - Ocean Tidal Wave Frequency
September 22nd to Septmber 27th - Dow Jones Consecutively Rose. Kp Levels. Solar Wind Speeds. C Class Solar Flare Numbers.
September 22nd to Septmber 27th - Ocean Tidal Wave Frequency
September 30th was a Friday, the condition yellow did not occur until late afternoon. Monday October 3rd to October 6th - Dow Jones Consecutively Rose. Kp Levels. Solar Wind Speeds. C Class Solar Flare Numbers.
October 10th to October 12th - Dow Jones Consecutively Rose. Kp Levels. Solar Wind Speeds. C Class Solar Flare Numbers.
October 10th to October 12th - Ocean Tidal Wave Frequency
October 13th to October 14th - Dow Jones Consecutively Rose. Kp Levels. Solar Wind Speeds. C Class Solar Flare Numbers.
October 13th to October 14th - Ocean Tidal Wave Frequency
During the months of October to December, during condition yellows, the effects are more powerful than usual.
November 1st to November 3rd, 2011 - Dow Jones Consecutively Rose. Kp Levels Solar Wind Speeds C Class Solar Flare Numbers.
November 1st to November 3rd, 2011 - Ocean Tidal Wave Frequency
November 25th to November 30th, 2011 - Dow Jones Consecutively Rose. Kp Levels Solar Wind Speeds C Class Solar Flare Numbers.
November 25th to November 30th, 2011 - Ocean Tidal Wave Frequency
December 19th to December 23rd, 2011 - Dow Jones Consecutively Rose. Kp Levels Solar Wind Speeds C Class Solar Flare Numbers.
December 19th to December 23rd, 2011 - Ocean Tidal Wave Frequency
So why does the Dow Jones rise when there are no C Class Flares?
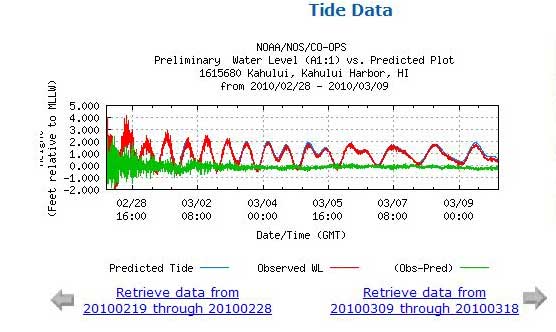
From February 14th to March 26th, 2010, there were almost no C Class Flares counted. So what made the Dow Jones Rise non-stop From Mar 24th, 2010 until March 30th?. Well we look at the sunspots to find why this occurred. As we know from our research that condition blues will make the Dow Jones rise. So on March 3rd, 2010, when this "break" on the dow occurred, the sunspot number increased from 39 to 40 with a 1 C Class Flare on the 4th. From March 5th to March 8th, 2010, the sunspots dropped from 35 to zero for 3 days, which also occurred over the weekend. The Dow dropped from March 5th to March 8th. The next rise in Sunspot Activity occurred on March 10th, and the sunspots peaked on March 14th, with 1 C Class Solar Flare. The Dow followed the same pattern, rising consecutively until dropping on March 18th. So we can see that when the sunspot numbers are lower, and then the condition blue takes effect, this energy returns stronger than before, causing a major rise in the Dow Jones that follows.
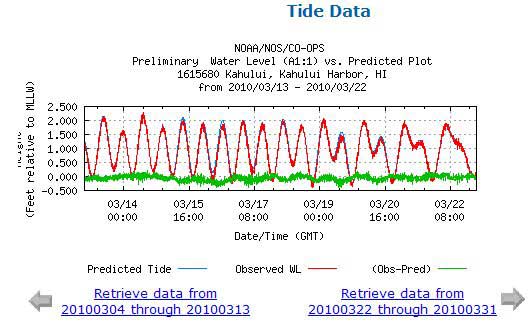
Okay, so let's pick another date during a low sunspot cycle, when there are fewer C Class Solar Flares, say between February 12th and 13th. As we can see this caused the Dow Jones to Rise consecutively from February 12th to February 19th, 2010. So it seems that during lower sunspot periods, when there are between 4 and 8 C Class Flares, the energy returns stronger, because it has not been experienced for a while.
Therefore there must be some type of evolution occurring during this condition yellow period. So where would we look for this evolution energy to manifest itself?, the ocean of course, which has evolved many species over millions of years. So let's take a look at the wave frequencies for these periods:
Data Courtesy of NOAA:
 March 20th 2010, Ocean Tidal waveforms
March 3rd 2010, Ocean Tidal waveforms
February 12th, 2010, Ocean Tidal waveforms
Archives Courtesy of NOAA
http://www.swpc.noaa.gov/ftpdir/indices/old_indices/
The Ocean Tidal Waveform is the "jump" in evolution. Everytime the Dow Jones rises during the condition yellow period, the Ocean Tidal Wave Frequency Waveform will always reflect this new "jump". I also show this same effect at the How Excessive Geomagnetic Energy Causes Psychological Outbreaks of Violence Research Article
Thank You for reading this article. If this or any other article has helped you or someone you know, please consider contributing to this site. Your contribution will ensure the continued publishing of unique and quality articles at no cost to all of our visitors and regular readers.