


Click Picture for a Larger Image

Next review the solar weather conditions
|
Our Sun's Solar Wind http://www.paradiseexcursion.com/solarwind.html http://www.paradiseexcursion.com/solarwind2.html http://www.paradiseexcursion.com/solarwind3.html
Our Sun's Solar Flux Activity http://www.paradiseexcursion.com/solarwind4.html http://www.paradiseexcursion.com/flux.html Our Earth's KP Activity Metrological and Similar Data
|
|---|
_______________________________________
New Forecast Rules

The higher the previous solar wind speed, the more firm the entry into 350. More of a boost is higher x-ray background levels that have just arrived at stronger levels.
On Average a new entry into the solar wind of 350 occurs on average every 2 weeks or 25 times a year.
Indicators of entry include KP will remain steady or go into reduction 24 to 48 hours after entry into 350.
The highest strongest dow results are obtained after waiting up to 7 days for it to enter 350 after being at high winds for a period of time.

Solar weather march 25th, 2015
Long Slow Wind Decline starting
Solar Wind
The high speed wind stream is expected to dominate the solar wind
environment through day one (25 Mar), gradually decreasing through days
two and three (26-27 Mar). Waning velocities are expected to decrease to
near 400 km/s by end of the period
Solar Wind Speed Activity
015 03 25 0900 57106 32400 0 7.1 544.2 7.44e+04
2015 03 25 1000 57106 36000 0 7.3 548.2 7.68e+04
2015 03 25 1100 57106 39600 0 10.4 557.2 7.15e+04
2015 03 25 1200 57106 43200 0 5.0 561.9 9.71e+04
2015 03 25 1300 57106 46800 0 11.6 575.4 7.29e+04
2015 03 25 1400 57106 50400 0 9.4 576.8 8.43e+04
2015 03 25 1500 57106 54000 0 6.2 582.7 1.13e+05
2015 03 25 1600 57106 57600 0 6.3 574.9 9.29e+04
420 to 430 entry coming soon - with possible override timeshift occuring on Thursday.
Visual Solar FLux LIne just starting with new activity after a quiet period
sunspots increaseing with 4.8 x-ray background
long term solar flux trend increasing (no momentum from the 100 drop point dow on Wednesday)
air force solar flux shows increase
5-DAY F10.7 CM FLUX FORECAST
25Mar15 135 26Mar15 140 27Mar15 140 28Mar15 140 29Mar15 135
30Mar15 130 31Mar15 130 01Apr15 130 02Apr15 130 03Apr15 130
non aggrevative
VI. Geomagnetic Activity Probabilities 25 Mar-27 Mar
A. Middle Latitudes
Active 15/15/30
Minor Storm 01/01/05
Major-severe storm 01/01/01
B. High Latitudes
Active 15/15/15
Minor Storm 25/25/30
Major-severe storm 20/20/35
KP forecast is for stronger on Friday. Due to timeshift override the stronger green period will manifest on Thursday.
2015 Mar 28 120 25 5
2015 Mar 29 120 25 5
2015 Mar 30 120 12 4
2015 Mar 31 125 10 3
2015 Apr 01 130 8 3
air pressure ready for rebound
goes flux is smoother
rays and dst inching up higher over the last few days
cp o.5
-----------------------
major discovery breakthrough
what this shows is that the metrological indicators (when around the 4.0 range), show pressure building that will be released at the solar wind entry gateway point.
as shown above for the cycle NOAA calendar even through we are at a higher level of red period, the long decline of the solar wind is going to override this. It may be a short term override with a lower dow on Friday?
Cycle Calendar courtesy of NOAA
http://www.swpc.noaa.gov/products/27-day-outlook-107-cm-radio-flux-and-geomagnetic-indices
Another method to evaluate when Time Shifting is Occurring
If there is a cooler or wetter climate than instead of whirling dust devils you will see a highly contrasted (or charged) sky with moving isolated separate thunderstorms. These "storms" will consist of independent rain showers and will be visible present against a strong contrasted sky.
You can also Use the Intuitive / Black Card method for day trading, just do the exercise at Sagittarius window
A 2nd KP Intuitive Booster
Besides the 5 to 7 rule, a second booster to key intuitive signals is if the KP activity is stronger or higher on the target scan date.

The red circle in the image above shows target date. The blue circle should be the KP in the range of between 5 and 7 and in increasing multiples of 2
Solar Weather Conditions as of March 22nd, 2015
Transit time image rougher
Current Solar Wind Conditions
2015 03 22 1000 57103 36000 0 6.4 675.6 1.11e+05
2015 03 22 1100 57103 39600 0 4.7 674.1 1.57e+05
2015 03 22 1200 57103 43200 0 3.9 663.3 1.79e+05
2015 03 22 1300 57103 46800 0 2.0 630.8 2.12e+05
2015 03 22 1400 57103 50400 0 1.4 651.4 1.14e+05
2015 03 22 1500 57103 54000 0 1.4 633.6 7.48e+04
2015 03 22 1600 57103 57600 1 1.0 601.1 1.61e+05
flux at 4.0
visual red line still flat
KP levels:
2015 03 20 18 4 2 4 3 3 3 2 4 32 4 3 5 6 4 3 4 3 24 5 3 5 3 3 3 3 5
2015 03 21 12 4 2 3 3 2 2 2 2 18 3 2 5 4 4 2 2 1 14 4 3 4 3 2 2 2 2
2015 03 22 -1 2 3 5 4 3-1-1-1 -1 2 3 7 5 6-1-1-1 24 2 3 6 4 4-1-1-1
as shown above the kp readouts were in the 10 to 14 zone or secondary kp intuitive gateway level
Intuitive scan was strong last night
forecast for KP is for it going into decline
all metrological indicators are showing a stronger dow and the xray flux is at 4.0 and steady
This analysis is close to or based on the chart titled: "Strength of FUture Dow Volume" and "energy polarity switch" and "solar wind speed"
Conclusion:
The red visual line will increase on Sunday/Monday, creating a strong condition blue for monday. Timeshift may move this up as long as solar wind continues into decline. A higher dow between 20 and 70 points expected.
Current Solar Conditions as of Saturday march 21st, 2015
Intuitive Answer - Stronger dow on Monday
Always start with the solar wind positions and forecast first
Solar Wind Forecast to remain high for a short term period, than go into the long slow decline
Solar Wind Transit Time Image rough - rescan on Sunday as it changes fast somtimes
Solar Wind Starting to go into a long, slow decline
Solar Wind
.24 hr Summary...
Solar wind parameters indicated the continued influence of a negative
polarity southern coronal hole high speed stream. Solar wind speed
ranged from 539 km/s to 718 km/s with a mostly negative (towards) phi
angle. Total field was ranged from 3 nT to 8 nT while the Bz component
was variable between +/-6 nT.
.Forecast...
Waning negative polarity high speed stream characteristics are expected
by the end of day one (21 Mar). A sector change to a positive
orientation and onset of positive coronal hole high speed stream effects
are forecast for days two and three (22-23 Mar).
Solar Wind Speed Info:
2015 03 21 0600 57102 21600 0 2.9 656.7 2.21e+05
2015 03 21 0700 57102 25200 1 3.1 649.7 2.71e+05
2015 03 21 0800 57102 28800 0 3.2 646.0 2.58e+05
2015 03 21 0900 57102 32400 0 2.5 653.5 1.87e+05
2015 03 21 1000 57102 36000 0 2.2 647.8 1.77e+05
2015 03 21 1100 57102 39600 0 2.2 639.1 1.54e+05
2015 03 21 1200 57102 43200 0 2.2 642.4 1.73e+05
2015 03 21 1300 57102 46800 0 1.9 640.5 1.93e+05
2015 03 21 1400 57102 50400 0 1.6 629.7 1.59e+05
2015 03 21 1500 57102 54000 0 1.5 611.8 1.35e+05
2015 03 21 1600 57102 57600 0 1.8 619.7 1.72e+05
Solar wind windows are 500 to 510 and 420 to 430
xray info
2015 03 17 114 60 810 2 -999 B3.3 2 1 0 4 0 1 0
2015 03 18 115 44 470 0 -999 B6.0 18 0 0 18 1 0 0
2015 03 19 109 71 420 1 -999 B3.5 2 0 0 8 0 0 0
2015 03 20 113 27 120 0 -999 B4.8 1 0 0 0 0 0 0
45-DAY AP FORECAST
21Mar15 012 22Mar15 020 23Mar15 020 24Mar15 010 25Mar15 005
26Mar15 005 27Mar15 015 28Mar15 020 29Mar15 025 30Mar15 012
31Mar15 010 01Apr15 008 02Apr15 010 03Apr15 015 04Apr15 012
5-DAY F10.7 CM FLUX FORECAST
21Mar15 115 22Mar15 115 23Mar15 115 24Mar15 115 25Mar15 110
26Mar15 110 27Mar15 110 28Mar15 110 29Mar15 105 30Mar15 105
Visual Red Solar FLux Line Flat
2mev forecast lower
long term solar flux going into rise, no momenum decline
Cycle Information
2015 Mar 20 100 12 3
2015 Mar 21 95 8 3
2015 Mar 22 95 8 3
2015 Mar 23 100 20 4
2015 Mar 24 105 8 3
As shown above another intuitive window is opening just before the 23rd
2015 03 19 19 4 4 3 4 4 2 2 3 47 3 4 5 6 7 4 4 3 28 4 4 4 5 5 3 3 4
2015 03 20 18 4 2 4 3 3 3 2 4 32 4 3 5 6 4 3 4 3 24 5 3 5 3 3 3 3 5
2015 03 21 -1 4 2 3 3 2-1-1-1 -1 3 2 5 4 4-1-1-1 20 4 3 4 3 2-1-1-1
the 23rd is a kp peak - right on microclimate date
VI. Geomagnetic Activity Probabilities 21 Mar-23 Mar
A. Middle Latitudes
Active 30/40/40
Minor Storm 05/20/20
Major-severe storm 01/01/01
B. High Latitudes
Active 15/10/10
Minor Storm 30/25/25
Major-severe storm 35/55/55
NOAA Kp index breakdown Mar 21-Mar 23 2015
Mar 21 Mar 22 Mar 23
00-03UT 4 4 5 (G1)
03-06UT 3 4 3
06-09UT 4 3 3
09-12UT 3 3 3
12-15UT 2 3 3
15-18UT 3 3 3
18-21UT 3 3 3
21-00UT 5 (G1) 5 (G1) 4
As we are at 4.0, the metrological is paid more attention to.
DST higher
Air pressure ready for rebound
CP values out of 0.2 range
Goes electron flux quieting down
Comic rays moving up higher the laste few days
Final Analysis:
The momentive energy that builds up on Sunday will carry on over to Monday, right at the start of a short term, but strong condition blue. This is due to the 4.0 x-ray range and the possible falling of the solar wind having had gradually declined the last 24 hour into a gateway range, if it keeps falling by sunday afternoon, it will build energy for the stronger dow. Also all metrological are solid for a stronger dow due to the 4.0 x-ray range. Most importan of all the visual red line solar flux is steady and quiet, just waiting for the monday shoot up. Also the intuitive signal is gaining strength due to the ideal kp range and the period just before active solar activity (the intuitive condition blue period)
We forecast a stronger dow jones or for the dow jones to close higher on Monday, March 23rd, 2015. We forecast between 20 and 40 points higher. Check back Sunday Afternoon for any changes to this forecast.
Saturday March 21st, 2015
Dow scan strength was at optimal levels, resulting in a good, clear scan. This was due to approaching gateway kp levels, as well as a condition blue approaching within the next 48 hours.
SOLAR WIND SPEEDS WERE AT 600 and were at high levels the previous 5 days (normalization now in effect)
ALSO XRAY LEVELS HOVERED AROUND 4.0 for the previous 3 days
THIS PROVES THAT A HIGH XRAY BACKGROUND LEVEL IS NOT NECESSARY FOR A CLEAR SCAN
THIS ALSO CONFIRMS THAT SOLAR WIND SPEEDS NEED NOT BE AT 350, AND THAT NORMALIZATION OCCURS AFTER A FEW DAY
IN SUMMARY:
The key intuitive window is at kp gateway speeds and 48 hrs just before a cond blue or increase in solar activity. Which can be plotted using the NOAA cycle forecast or air force data.
Another interesting thing to note is that the Galactic Center, which begins at -- 1.65 degrees Libra reaches its midpoint at 17.58 degrees Scorpio. Does this mean that it is the Galactic Center that is causing the "noise", and there is a rift of "quiet" just before the midpoint of this Galactic center rises in the east?
What is the Galactic Center?
It is the center of our milky way from which a large amount of energy flows. It acts like a cosmic vacuum cleaners and is capable of sucking in all the outdated, stubborn, and hopelessly blocked patterns so that new thought-forms, ideas, attitudes, and behavioral patterns may burst to the surface. It can also function as a cosmic sources of knowledge, emanating messages which need to be deciphered. When we can decipher this energy we have the messages of the future. The Galactic Center is positioned at Sagittarius 27°01.
Higher solar winds speeds block wormhole signal
Higher solar winds speeds block wormhole signal
Higher solar winds speeds block wormhole signal
Higher solar winds speeds block wormhole signal
In the Name of the Best Within You, Do Not Fear for your success or creativity in fear of those that would claim your precious mind.....DO NOT let your fire ever go out, spark by irreplaceable spark, DO NOT let the hero in your soul perish in Lonely Frustration for the life you deserve, but have never been able to reach. The world you desire can be won, it already exists, it is real, it is possible and it is your birthright to claim.
Time Travel
On Thursday March 20th, 2015, the dow closed down -117.16 (0.65%)
Forecast was incorrect this date.
e 19th of march fail was based on the following - NO LONG TERM SOLAR WIND DECLINE INTO 600 window
KP LEVELS WERE AGGRAVATIVE
Goes electron flux was much more disturbed
The Dow was actually lower for over half of the previous day than arrifically shot up at the end of the day showing that it was really lower the day before
These 2 main parameters are enough to make the decision based on logic/mind
If you were to look at the NOAA cycle you would have seen that the cycle #2 was just beginning. So the cycle 1 energy was still very high (a red zone).
This is enough info to make future decisions based on mind/logic
Dow Analysis:
The Dow Scan was very hard to do, the signal was very, very weak.
Solar Wind Speeds at around 600
Below is solar wind speed on march 19th, 2015
2015 03 19 1200 57100 43200 0 2.1 583.3 1.61e+05
2015 03 19 1300 57100 46800 0 1.9 564.4 2.75e+05
2015 03 19 1400 57100 50400 0 1.5 562.8 2.63e+05
2015 03 19 1500 57100 54000 0 1.9 599.9 2.58e+05
2015 03 19 1600 57100 57600 0 2.4 596.9 2.20e+05
2015 03 19 1700 57100 61200 1 2.3 588.8 2.49e+05
2015 03 19 1800 57100 64800 1 2.6 590.5 2.43e+05
2015 03 19 1900 57100 68400 0 2.1 587.1 2.26e+05
2015 03 19 2000 57100 72000 0 2.4 593.0 2.02e+05
This proves there is no gateway speed at 600.
Below is xray background flux at 6.0 .- THIS CAN BE FORECAST HIGH HIGHER 2MEV'S FORECAST
015 03 16 117 57 390 0 -999 B3.6 6 1 0 9 2 1 0
2015 03 17 114 60 810 2 -999 B3.3 2 1 0 4 0 1 0
2015 03 18 115 44 470 0 -999 B6.0 18 0 0 18 1 0
On Thursday March 20th, 2015, the dow closed down -117.16 (0.65%)
Forecast was incorrect this date.
kp WAS AGGREVATIVE ALSO AT RECORD HIGH LEVELS
meTROLOGICAL
GOES LINE EXTREMLY DISTURBED, DST MAJOR DROP, COSMIC RAYS MAJOR DROP.
Details concerning the forecast for March 19th, 2015.
KP levels peaked in the 45 range making signal return more challenging than usual.
Please note the strength of the information coming through the information wormhole varies according to the solar weather conditions. As of March 18th, 2015, the overall solar weather conditions were not optimal for a wrong wormhole communications signal therefore the following extra details are being included in this forecast:
The Dow will open strong in the mid morning at the opening, than peaking close to midday, next it will decline and show more weakness towards the end of the trading day.
Details - Wormhole signal strength conditions on March 18th, 2015 - Weak
Solar conditions on March 16th, 2015.
On Monday March 16th, the soalr wind crossed the 350 threshhold creating a higher dow. Thus by tuesday the energy will have "depressurized". Also DST happened to "hover" at 0.2 the last few days . X-ray was in the 4.0 range, Visual red line more shaky the last few days. KP peaking tues and weds.
Dow scan results for march 14th, 2015 and the dow to close lower on the following tues
Higher Dow 6, 2 3 FOR TUES
Lower Dow 8, 6 8 6 FOR TUES
Analysis;
30% lower
TUES IS END OF TIMESHIFT DUE TO END OF CYCLE 1 and start of cycle 2 also no 350 on TUES
Teachers fountain is key intuitive location - take rhodioa at 3pm at this location
IT IS CONFIRMED A HIGHER XRAY LEVEL BOOSTS THE CLARITY IF THE SIGNAL - BECAUSE SUMFLOWR SEEDS RESONATE WITH THE DOLAR FLUX PLACING THEM IN A TIN VAN IN THE PROCIMITY OF DOING THE SCAN GREATLY ENHAVES THE DIGNAL
THUS PROBES WORMHOLES ARE PARTLY BIOLOGICAL
Lower 4,0 flux below 4,0 - observe metrogical
Effects of aggregating kp will show due to solar wins speed being below 350
Sunspots in decline
2mevs should show lower as well as lower couch rays
THE NEW MOON US SPEEDING UP THE REDUCTION OF SPLAR WINS SPEED
Solar wind depressire below 4,0 minor condition orange
The signal is stronger on TUES, so do the forecast Sunday as conformed,
Results of Dow scan weds night march 11th
Fianl analysis of scan
Cme - the real 350 wind is not until next week after the weekend shock wave passes
Kp - kp is increasing rather than going into the moth decline
The solar wind did not take 3 days or more to go into a gradual decline. But instead dropped quickly before a cmw with kp increasing with a stronger cray background flux level just before a major cme
The 72 he solar wind forecast was for a jump in solar wind speeds due to a cme shockeave creating a condition yellow in the coming 72 hours.
Higher Dow for Friday - 3
Lower Dow for friday - 11
Second scan to be done at around 50% into sag window,
second scan
Higher close 4
Peer close 8
Third scan
Lower Dow 9
Higher Dow 3
350 wind depressirized
Higher X-ray flux
4th scan
Higher 3 and 4
Lower 15
Dow Analysis on March 11th, 2015
KEY DISCOVERY - "Normalization can occur also during times of weak solar activity in the mini-cycle. Normalization will be revealed the microclimate weather changes are lessened or weaker, but there will be a day when it shows a drastic change. When this occurs, the energy "shifts" a day ahead, meaning in some cases the microclimate date may move ahead a day or a few hours earlier than normal. When you see a microcliamte day that has a major change in the weather, that reflects higher solar activity, and it happens to occur during a cycle #2 period or quieter period of solar activity, the drastic change in the weather at microclimate will show that the last few days of normalization are about to be shaken up and the dow may reflect results 24 hrs ahead of time. To watch for this, read the solar weather forecasts a little more closer, as more M class flares will be forecasted. Also on this day of March 11th, the solar wind speed never entered the 350 range, but instead "hovered". This caused the dow to be stronger in the morning, but the latter half of the day the dow had closed lower as forecasted. This hovering was due to higher solar activity and lessened kp activity.
Forecast for lower dow on Weds Mar 11th, 2015 . Solar weather conditions
Sunspot levels are winding down
Visual Solar Flux Red line is winding down
KP is higher carrying with it the energy from the last few days of aggressive activity, including the drop of over 300 points
in the dow jones
the long term solar flux is towards the end of its momentum phase
even through the solar wind looks like it will enter 350 the next day, there is still too much solar activity forecast, and if the 350 occurs on Tues afternoon,the energy will have "decompressed" by Wednesday morning.
Intuitive Sagittarius Exercise was strong for a weaker/lower dow jones on Wednesday
transit time solar wind speed is still disruptive
most important of all the KP levels were at the key intuitive gateway levels, so the decision was based on heart and the strength of the intuition feedback received, which explains why it was so strong and clear.
Higher solar winds speeds block wormhole signal
Higher solar winds speeds block wormhole signal
Higher solar winds speeds block wormhole signal
below is the solar wind speed "hovering" above 350 on Tuesday afternoon:
2015 03 10 0900 57091 32400 0 1.2 377.2 4.60e+04
2015 03 10 1000 57091 36000 0 1.1 375.1 4.76e+04
2015 03 10 1100 57091 39600 0 1.3 365.8 5.51e+04
2015 03 10 1200 57091 43200 0 3.8 367.1 3.28e+04
2015 03 10 1300 57091 46800 0 3.8 370.4 3.25e+04
2015 03 10 1400 57091 50400 0 3.1 366.8 4.97e+04
2015 03 10 1500 57091 54000 0 2.5 363.7 9.32e+04
2015 03 10 1600 57091 57600 0 3.2 367.3 7.58e+04
2015 03 10 1700 57091 61200 0 2.3 377.1 6.74e+04
2015 03 10 1800 57091 64800 0 3.6 374.5 4.41e+04
2015 03 10 1900 57091 68400 0 4.3 377.7 3.68e+04
Upcoming Forecast
Entering a strong cycle #2
The intuitive energy is strongest the previous 6 hours just before Saggitarus A happens to rise above the eastern horizon.
At about 13.5 hours LST, Sagittarius A* happens to be rising above the horizon.
Next 18 hours LST, Sagittarius A is at Zenith or roughly 30 degrees above the horizon in the due south direction.
This is for locations between 32 and 55 degrees North.
Is dajavu hard to hear? as cycle #2 winds down, if you find that the Sagittarius exercise is cloudy and KP is out of the gateway range of 5 to 7 and the microclimate weather changes are more minor than usual and more mild use your mind, instead of intuition to make the forecast. This is where logic will get results.
There must exist a balance between logic and intuition at the right times for a successful forecast.
When you are in a cycle #2 and microclimate changes are not as severe, avoid the sunday forecast because there is lessened momentum energy during this low energy cycle.
Instructions for Understanding and Creating Forecasts
First it is key to understand the sun's spectrums of energy which you can learn more about below:
http://www.ez3dbiz.com/in_depth.html
Next it is key to read through the Equasions
Z = Y + Q = X = O and R
Where Z represents the overall cauldron or chamber of energy that builds up in pressure that is gradually released affecting human emotion and/or perception including the markets or those markets showing the most productivity gains. This is represented shown and expressed by X, or the end result.
Q represents subcomponents of the various energy spectrums (X-ray background flux, S Optical and C. Class etc.) and of in Y, and which are gradually contained in Z and whose effects are felt / observed in X.
Where O represents the pressure building and R the pressure being released or descending.
The varying energies expressed by Y are dependent on the factors in Q
S X D & D
Where S represents the stock market and D represents cycle 1 and G and Cycle 2. This is related subcomponent to O and R.
D is dependent on the amount of energy contained by Y and G is also dependent on Y.
This is a related subcomponent to O and R.
D is dependent on the amount of energy contained by Y and where at certain times, the energy levels of Q will fluctuate to cause a swing or change in the Dow from higher to lower and vice versa.
Z = Y (squared) + Q = F & H = AZ
Where Z represents the vat or cauldron of emotional energy. Y (Squared) the increase in energy and Q, the increase in S. Optical or C. Class energy and Q the subcomponents.
F. Represents the stronger Dow and H the weaker Do.
AZ represents the polarity switch or change in the direction of the dow jones from high to low or vice versa, which occurs at teh microclimate switch point date and when teh KP goes from high peak to a low peak and vice versa. Long term solar flux decrease momentum can cause or concentrate the energy at the switch point date.
The strength of the DOW
F & H + G + V + W = J (Squared)
Where F and H represent the Dow and G represents cycle #2.
This is partly based on W, which represents the dow position the previous 24 hours.
V is based on the momentum, which is caused by the start of the decline of the solar flux after it has recently peaked. This momentum also can serve as momentum in the direction of the dow jones. If the microclimate is or if teh dow is weaker the last few days, this momentum will materalize on the microclimate switch point date.
J (squared) represents the energy to create a strong swing or the strength of the drive for the direction of the dow.
Thus the expression of Z contains within it a poliarity which after being built up by Y, changes its polarity due to factors determined by Q.
Polarity switches occur most common when the solar wind speed is out of gateway harmony ranges and the cycle has "normalized and may be influenced by short bursts of solar activity such as a condition yellow.
The high levels of Y (squared) with Y (squared) representing a major increase in energy levels caused by O.
The gradual build up of energy are responsible for the polarity switch, which thus causes a new direction for the dow to flow. A disruptive solar wind transit time image (photo) can mean a weaker dow short term.
A polarity switch can happen more strongly during periods of higher S. Optical, due to stronger solar activity.
F & H = T and T (squared) + Q or Q (squared) = F or H.
Where the dow jones high and low or weaker or stronger dow jones is affected by the sun's solar wind with T representing the solar wind harmony gateway entry speeds and T (squared) representing the out of gateway solar wind speeds.
J (squared) can be determined by the factors occurring in Q and the amounts of energy supplied by Y.
If the x-ray background flux levels are at a high level, (a subcomponent of Q), represented by Q, and T is present it will cause a stronger J (squared) reaction. This can be further enhanced by higher levels of Y (squared) represented by Q (Squared) = Major Swings.
With Q (squared) representing high energy levels caused by Y (squared)
GateWays
Gateways move up in multiples, being strongest at the lower end of the spectrum. KP moves up in multiples of 1 starting at between 5 and 7. Therefore KP in the range of between 5 and 7, and 10 and 14 and 20 and 28 are key gateways. Intuitive abilities are enhanced during this time so we can show this by the following formula:
K X 2 X 2 = I
Where K represents KP energy and the #2 the doubling of KP energy, as it moves up in the intervals.
The second and one of the most powerful intutiive gateways is when there is a peak in KP activity on the target microclimate date
X - Ray Background Flux
Much like the gradual long solar wind decline into the 350 override phase (including the micro-climate date), the reducing x-ray background x-ray flux declining into the 4.0 range causes an override of all Q indicators. We can show this with the following equation.
Z + H - Q = X
Where Z represents the emotional cauldron of energy and H the entering into the KP Gateway Range after a decline of 72 hours or X-ray background flux into the 4.0 range. This cancels out Q the multiple sub component variables. With X being the end result.
Our Sun's Solar Wind
Like KP levels, the solar wind has its own levels of strength creating a higher dow that moves up in multiples of 80 at a time and exerts its most influence when the solar wind has been in an undisturbed gradual decline towards the 350 range and similar gateway speeds. Although at higher gateway levels if the decline is not long enough there will be no override.
We can use the same equation as the KP formula substituting G for S.
Z + S - Q = X
A balance must exist between making forecasts based on Intuition and Logic. As KP levels fall out of the gateway range, which is most common at the mid to end part of cycle #2, instead of listening for the strength of DEJAVU, instead make the forecast based on logic or mind stemming from the printed out solar weather variables. We can show this with the following equation.
I + D + K = X
Where I represents making the forecast based on intuition and D cycle #1 and K the gateway window of KP = X, being the final end result.
L + G + M = X
Where L represents making the forecast based on logic and G cycle #2 and M the KP levels out of gateway harmony range with X being the end result. T squared may also factor into this. (t squared the solar wind).
The first increase in 2mev's after a quiet period can be found by the first increase in 2mev protons. This combined with the first rise into and above 4.0 x-ray creates a stronger dow and can create an override for the upcoming micro-climate switch point date especially if a time shift is occurring.
The x-ray background flux may "hover" just like the solar wind and maintain its hovering position below 4.0 during this time at which point an upcoming micro climate date within 48 hours will be forecast. The forecast for this type of situation should be done on the day the 2mev's occur as it overrides the upcoming micro-climate switch point date, including forecast ed aggressive KP levels.
There is always a return to balance of energy. After it has "built up" gradually during cycle #1. This re-balance occurs as a stronger dow and factors or signals that cause this balance, are the override gateway entry points discussed earlier. These include x-ray, 350 wind.
Z + D + R - Q = X
Where Z represents the cauldron of energy and D represents cycle #1, the building of energy and R represents the override or re balance occurring, overriding Q. X is the final end result.
Depressurization
As the long term solar flux has peaked and is starting to go into decline just after a peak the override factor is much less because stimulating solar activity is lessened. If the dow has closed up higher during this time, the energy is now lost and weakened or "depressurized" and you can expect a weaker dow at the next upcoming micro-climate switch point date. The slightly stronger dow may be preceded by the solar wind having entered the gateway speed previously.
L minus + T + C = F + U + H
Where L represents a long term solar flux going into decline just after peaking and T the solar wind gateway and C the micro climate switch point date and F the slightly stronger dow. U represents the depressurization of energy having been released and H represents the weaker dow. This than leads to cycle #1 where the 4.0 gateway re begins all over again, the cycle repeating itself.
Time Shifts
At the mid to high point of cycle #2, from the micro-climate switch point date if there is higher S. Optical solar activity which has been going on for the previous 72 hours, the energies from the forecast ed micro-climate switch point date will move ahead 6 hours. This means if the solar wind is forecast to enter 350 on Friday afternoon, than the results of teh solar wind will manifest on Friday morning. So during a time shift factor into account the time difference from the date of the micro-climate switch point date. You will also discover that at sunset, dust devil whirlwinds of hot/cold temperature will occur in the forest or outdoor region you are in, confirming the time shift is occurring.
As cycle #2 approaches, the energies manifest more exactly on the micro-climate switch point date.
Making Adjustemnts for "Time Shift"span>
At the first sign of an increase in S. Optical, the first 72 hours (this can be forecasted by watching for signs of increased solar activity in the solar weather reports), the energy that will manifest on the microclimate date will jump ahead 6 hours. Extremely high levels of future KP may also contribute to this. As S. Optical levels start to decline as well as solar activity, the 6 hour window closes, and the energy manifests more accuractly on the microclimate switch point date. You will also receive "temperature changing whirlwinds" in the local weather at dusk, signifying that the 6 hour time shift window has activated. This simply means that if there is a 350 wind speed forecasted to occur at the end of the day, re-calulate the forecast 6 hours ahead during this time shift because the dow will close higher at the start of the day acting in accordance with the timeshifting reference frame.
We can use these equations and charts to plot the future industrial progress of planets that are populated in our universe that have a sun similar to ours.
How "dust devils" can tell you a Time Shift is Occuring
These will be most common at dusk 24 to 48 hours before the microclimate switch point date.
Dust devils, even small ones (on Earth), can produce radio noise and electrical fields greater than 10,000 volts per meter.[15] A dust devil picks up small dirt and dust particles. As the particles whirl around, they bump and scrape into each other and become electrically charged. The whirling charged particles also create a magnetic field that fluctuates between 3 and 30 times each second. Dust caught up in these vorticies undergoes frictional charging, like rubbing your hair with a balloon, generating voltages of many thousands of volts
These electrical fields that are occurring are what is causing the time shift phonneminia during higher solar activity. These same fields may have time expansion properties.
The below paper explains the magnetic field:
Koch, J., and N.O. Renno (Dec 5–9, 2005). "Convective-radiative feedback mechanisms by dusty convective plumes and vortices". Fall meeting of the American Geophysical Union.
Ludlum, David M. (1997). National Audubon Society Field Guide to North American Weather. Knopf. ISBN 978-0-679-40851-2.
General Misc:
In general it is best to calculate the forecast in terms of a release or balance of built up pressure that is gradually released and built up over a series of stages. As an example at 4.0 this pressure is normal and when 4.0 first enters, the energy is slowing depressurizing, creating a stronger dow. As x-ray levels gradually grow towards 7.0 and above, pressure is building. During this building phase, watch for signs as it builds to the 7.0 or higher because a polarity switch will occur causing a weaker dow. This polarity switch is usually caused when S. Optical reaches a high and the switch will occur on the micro-climate date. As it descends again into the 4.0 range and the solar wind speed gradually slows down into the 350 range over a period of day, it will create an override or another polarity switch casing the dow to close higher within 24 hours of the micro-climate date, and can involve the 6 hour time shift equation. During this re-entry the energy will cause a larger swing of the dow to occur. This is because as these variables first enter the gateway ranges, the pressure is relaxing itself, causing polarity changes and new high or low to occur. In summary, the more pressure to be released, than the more the dow swings will occur higher or lower.
___________________________
Next it is key to read through the charts


Next review the solar weather conditions
|
Our Sun's Solar Wind http://www.paradiseexcursion.com/solarwind.html http://www.paradiseexcursion.com/solarwind2.html http://www.paradiseexcursion.com/solarwind3.html http://www.paradiseexcursion.com/solarwind4.html
Our Sun's Solar Flux Activity Our Earth's KP Activity Metrological and Similar Data
|
|---|
After reviewing these 4 steps you will have an idea where the dow jones will be the following day.
Please note this is the rough format and over time the process will become more simplier. It is not complex than reading the stock business section in the newspaper once you understand the meanings.
General FAQ
Microclimate Switch Points
What is a microclimate switch point? It is when the local weather changes. It may change from dry to wet, cool to warm, calm to windy or any other manner of conditions. This will also be reflected in a change in the sun's solar flux, higher or lower. The future forecast for the Dow jones is done 24 hours before a microclimate switch point takes place. In some cases, the weather will have to be closely watched for the upcoming microclimate switch point, because it can "jump" a day ahead of the forecast. We can get a rough idea because the 2mev levels will be stronger around this period. A sudden rise in the 2mev levels or a sudden drop will sometimes mirror the upcoming microclimate switch point date.
At the forecasted KP point date the weather will change 24 hours before OR after this date, signifying a true microclimate switch point date. This will conform that the dow will be influenced by the current existing solar weather conditions 24 hrs ahead. Forecasts made without this switch point date are almost impossible to predict. Think of these as mini wormhole windows that open up allowing the information come through more strongly at these times than at other times.
As we can see from the image below on the forecasted date of the KP activity, the weather temperature and wind changes. This is a sign of a strong switch point occuring. The Red circle shows peak of KP activity (position 4) and going into decline. The purple circle shows a peak in Solar Flux Levels and going into decline (position 4). Sometimes these peaks occur on the same day, at other times a few days apart, but we know when they occur, because there will always be a change in the local weather within 24 to 72 hours. For more info you can view our microclimate article.

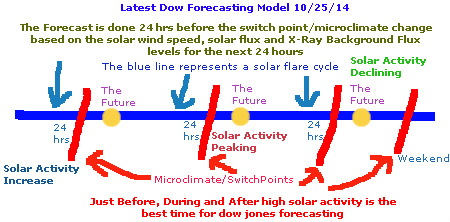
As the image above shows, the forecast is made 24 hours before the actual change in the weather (microclimate switch/cross point). So a forecast is made using the following format:
1: In a solar mini cycle, we look at the weather forecast for a change in the weather 3 days ahead (as shown by the yellow dot titled: THE FUTURE in the above image).
2: On day 1 of 3, we look at where the solar weather conditions are headed for the next 24 hours.
3: A forecast is made on day 1, twenty-four hours in advance based on the solar weather conditions for the next 24 hours.
In some cases the local microclimate weather will change every 48 to 72 hours indicating multiple position changes within a week, allowing for more accurate forecasts.
What does Saturday Back in Time Mean?
If there is a high KP on a Saturday and the conditions are right the forecast will be posted on Thursday, because the energy from Saturday is reflected in the Markets on Friday. This proves that emotion is not governed by time, but has its strongest effect when 2 events occur 24 hours within each other.
The polarity switch
The more S. Optical and C. Class flares, the sharper or more abrupt the polarity switch or swings in the dow or changes in the weather, especially if it occurs during a cycle #2, when this energy is "depressurizing". This pressure or "vat" of built up energy is released via "polarity" switches in "stages", causing swing cycles to occur in the dow.
The cycles
Each solar flare mini cycle contains within it "sub mini cycles" which are determined by microclimate weather changes. When a polarity switch occurs, a new sub mini cycle begins, which then ends / begins at the next microclimate switch point.
KP Energy
KP has 2 behaviors in Z or the "Vat of emotion". 1: It acts as a previous memory from the past and 2: it motivates or "re-motivates" energy/behavior from the base creating and guiding the cycle.
Please note to boost intuition when doing forecasts, a test is run through in the mind as having posted the forecast and an intuition scale of 1 through 10 is imagined with 10 being the highest (a more feeling of harmony if the forecast is correct) intutiive level or successfull forecast and 1 the lowest (more agitative feeling if the forecast is wrong). This is most accuracte when the constellation sagitarius sets over the western horizon, which is in the Milky Way. You can learn more about inuition and the Milky Way by visiting the links below:
The Link Below has the very best interpretation of what I have just explained above:
Recommended Reading: Intuition: Local Sidereal Time, Intuition and Sagittarius A
http://www.p-i-a.com/Magazine/Issue16/Intuition_16.htm
THE GALACTIC CENTER’S INFLUENCE ON PSI AND ESP
http://occultview.com/2011/01/09/the-galactic-center%E2%80%99s-influence-on-psi-and-esp/
Book: Enlightenment East and West
It takes approximately 9 hours for the Milky Way to set going from the tip of the Small Sagittarius Cloud to the end of the Large Sagittarius Cloud. I have had best results during the last 6 hours leading up to 13:30 LST time.

I have had very good results doingthe saggitarius exercise in a forest location that is quiet and still or undisturbed.. This is because the majority of animals and nature rely heavily on their intuition to survive and live in the forest, therefore being in an environment with enhanced intuition around you helps the intuitive "signal" become clearer

One very interesting discovery is that it is now a scientific fact that intuition is increased as Sagittarius sets over the western horizon. What I have also discovered is that as KP is within a certain range (between 5 and 7) and during the last 6 hours of 13:30 LST as the constellation Sagittarius sets over the western horizon, when I use intuition to check the future dow, my intuition is at a major peak. What is interesting in the correlation here is that KP levels have just peaked and are starting to decline or "set", much like the constellation Sagittarius has risen in the sky and than is setting, a window of intuition peaks during this window when these energies have peaked and are in decline. What is also interesting is intuition is also enhanced just before and after the full moon another period of peaking and than declining energetic energy.
Research of Correct Forecasts in Relation to KP levels:
Source courtesy of NOAA:
ftp://ftp.swpc.noaa.gov/pub/indices/old_indices/2015Q1_DGD.txt
Monday March 2nd, 2015 - forecast 100% accurate
KP Period:
2015 02 28 11 1 2 3 1 2 4 2 3 18 1 1 3 4 3 5 3 3 13 1 3 3 2 2 4 3 3
2015 03 01 23 5 4 5 4 3 2 2 2 36 4 5 5 7 2 1 2 2 28 5 5 5 4 2 2 2 3
2015 03 02 18 4 3 4 4 3 3 3 1 60 3 5 8 6 5 4 3 1 28 4 4 5 5 4 4 3 2
2015 03 03 10 3 3 2 2 2 2 1 3 21 1 2 3 6 5 1 1 2 11 3 3 2 2 2 1 2 3
On March 2nd, KP was in the 2nd day of decline
Monday February 23rd, 2015 - forecast 100% accurate
KP Activity
2015 02 21 8 3 3 1 1 2 2 2 2 6 2 2 2 3 1 1 0 1 7 3 3 1 1 2 1 1 2
2015 02 22 6 2 1 1 2 2 2 1 2 7 1 2 1 3 3 2 1 0 7 3 2 1 2 1 1 1 2
2015 02 23 14 3 2 2 3 3 4 2 3 25 2 1 4 5 5 5 3 2 17 3 3 3 3 3 4 3 4
2015 02 24 21 5 4 4 4 2 3 2 2 41 5 5 6 6 5 3 2 1 25 5 5 4 4 3 2 2 3
2015 02 25 7 2 1 3 2 3 2 1 0 20 0 0 3 6 5 2 2 0 9 1 1 3 2 3 2 1 1
KP peaked and declined 2 days later
February 18th, 2015 - forecast 100% accurate
KP activity
2015 02 16 4 0 1 0 1 2 1 2 2 3 0 0 2 2 1 0 1 1 5 0 1 1 1 1 1 2 3
2015 02 17 18 3 2 3 3 3 3 3 5 27 2 2 3 6 3 5 3 4 22 3 3 3 4 3 3 4 5
2015 02 18 15 5 3 3 3 2 2 2 2 28 4 4 5 5 5 3 2 1 19 5 4 3 3 2 2 2 3
2015 02 19 5 2 2 2 1 1 2 1 1 8 1 2 3 1 3 3 1 1 8 3 3 2 1 1 2 2 2
2015 02 20 4 0 2 2 1 2 1 1 1 7 1 0 2 3 4 1 0 1 6 1 2 2 2 2 1 1 2
KP Peaked and in decline
February 13th, 2015
KP activity
2015 02 11 5 2 3 0 0 2 2 1 1 8 1 1 0 2 5 1 0 0 7 2 3 1 1 2 1 0 1
2015 02 12 3 1 0 0 1 2 1 1 1 4 0 0 0 0 3 3 1 0 5 2 1 1 1 2 2 2 1
2015 02 13 2 0 0 0 1 2 1 1 1 2 0 0 0 3 1 0 0 0 3 0 0 0 1 1 1 1 1
2015 02 14 2 0 1 1 0 1 1 1 1 0 0 0 0 0 0 0 0 1 3 0 1 1 1 0 0 1 1
2015 02 15 5 0 2 2 1 3 1 1 1 11 1 0 2 3 5 3 1 0 6 1 2 2 2 3 1 1 1
KP peaked the day before and was in decline on the 13th
February 11th, 2015 - forecast 100% accurate
kp activity
2015 02 08 7 1 2 2 2 2 2 2 2 14 1 2 5 4 2 2 2 2 10 2 3 3 2 2 2 3 3
2015 02 09 5 2 0 1 0 2 2 2 2 7 2 0 0 1 4 3 1 1 8 3 1 1 1 3 2 2 3
2015 02 10 6 1 2 1 1 2 2 2 2 3 0 1 0 0 2 1 1 2 7 1 3 1 1 1 2 2 3
2015 02 11 5 2 3 0 0 2 2 1 1 8 1 1 0 2 5 1 0 0 7 2 3 1 1 2 1 0 1
2015 02 12 3 1 0 0 1 2 1 1 1 4 0 0 0 0 3 3 1 0 5 2 1 1 1 2 2 2 1
KP peaked the day before
Monday February 9th, 2015 - forecast 100% accurate
kp activity
2015 02 06 4 0 1 2 2 2 2 1 0 4 1 1 1 2 2 1 1 0 5 1 1 2 2 2 1 1 0
2015 02 07 9 1 0 3 4 2 2 1 2 23 0 0 3 6 5 4 2 1 9 1 0 3 3 2 3 2 2
2015 02 08 7 1 2 2 2 2 2 2 2 14 1 2 5 4 2 2 2 2 10 2 3 3 2 2 2 3 3
2015 02 09 5 2 0 1 0 2 2 2 2 7 2 0 0 1 4 3 1 1 8 3 1 1 1 3 2 2 3
2015 02 10 6 1 2 1 1 2 2 2 2 3 0 1 0 0 2 1 1 2 7 1 3 1 1 1 2 2 3
2015 02 11 5 2 3 0 0 2 2 1 1 8 1 1 0 2 5 1 0 0 7 2 3 1 1 2 1 0 1
2015 02 12 3 1 0 0 1 2 1 1 1 4 0 0 0 0 3 3 1 0 5 2 1 1 1 2 2 2 1
kp was in its 3rd day of decline
In summary, when KP levels are declining especially within 48 hours after a KP peak and in the range of between 5 and 7, intuition is enhanced as shown by the kp numbers above. This may move up in intervals of 7 or 8 arriving at 14, 21 and 28, much like the solar wind harmony gateway speeds move up in multiples of 80, so further research is necessary to confirm these "windows".
Now march 5th, 2015 the forecast was incorrect, however we have made proper modifications to the model so this does not happen again.
To add to formula:
A decline in KP + cycle #2 = Intuition is stronger
Date of Next Posting For Information Obtained from the
Wormhole Informational Access Data Point
This is a website in beta testing mode refining our dow forecasting model. As of Nov 15th, 2014, we are currently at test 7 of 30. We hope to acheive 100% Dow Forecasting on or before test #30.
This is an advanced solar weather forecasting site, if you are new and want to know what the meanings mean, I suggest you visit the link below for a better understanding of the data used on this site.
http://www.ez3dbiz.com/in_depth.html
Extracting future information via wormholes and making accurate dow jones forecasts
Cycle Calendar courtesy of NOAA
http://www.swpc.noaa.gov/products/27-day-outlook-107-cm-radio-flux-and-geomagnetic-indices
This site is constantly undergoing revision, especially the equations, so it is key to backup/download this site at various times, so the information stays current and safe. You can download this entire website in .PDF format by vising the link below.
http://pdfmyurl.com

We forecast a weaker dow jones or for the dow jones to close lower between 30% and 40% on Friday March 6th, 2015
On Friday march 6th, 2015, the dow jones closed down -291.59 (1.61%). Therefore our forecast was 100% Correct.
Analysis of the successfull Dow Jones Forecast for Friday March 6th, 2015.
There was a polarity shift/change on Thursday March 5th, 2015. This is because the dow had closed up over 100 points on Wednesday than lower on Thursday (polarity of going from high to low). This polarity shift was caused by the Microclimate Switch Date + Solar Wind Gateway entry speed of 420 + a more active solar flux.
The polarity shift on Friday March 6th, 2015 going from a slighly higher dow to a weaker dow was caused by the microcliate switch date + solar wind speeds out of gateway harmony speeds + more disturbed and higher visual solar flux red line. There was also a condition yellow on Friday Morning March 6th, 2015. x-ray background flux increased to 6.7 (above the 4.0 override x-ray level)
Solar wind speed on Friday March 6th at 8 a.m. was 484.3 - way out of gateway harmony wind speed.
Misc:
A decline in KP + Solar Wind Entering Gateway Entry Speed + cycle #2 = Stronger Dow Jones only when the conditions are right.
additional info:
Even though the solar wind speed entered 520 on Saturday, which is a gateway harmony speed, there was no KP spike on Saturday and the long term solar flux was in decline. Therefore no override leading to a green occurred. Also there was no long term decline into the 520 gateway speed, which gives it more override power, much like the 350 entry which is the strongest override condition, allowing for a stronger dow.
Also KP values were above the 5 and 7 range and were approx a 10 on Satuday:
ftp://ftp.swpc.noaa.gov/pub/indices/old_indices/2015Q1_DGD.txt
Solar weather conditions contributing to the forecast for a lower dow jones on Friday March 6th, 2015.
I believe the high in the dow has passed and due to more agitative solar weather forecast will cause a lower dow on Friday March 6th, 2015.
Disruptive Solar wind transit time image
Solar wind speeds expected to increase
Current Solar Wind Speed: 421.9
Long term solar activity is showing a low or ending (momentum)
KP continuing to decline
There is no KP spike on Saturday and KP is showing non-agitative levels
Metrological data
cosmic rays, dst lower
air pressure at high levels
We forecast a weaker dow jones or for the dow jones to close lower between 30% and 40% on Thursday March 5th, 2015
On Thursday March 5th, 2015 the dow closed up; +39.37 (+0.22%)
Our forecast was incorrect for this date:
Lessons Learned from this forecast:
Solar wind speed entered the 420 gateway point quicker than expected.
x-ray background levels were dropping towards 4.0 and solar flux visual line started increasing. (condition blue period)
We were at a period of declining KP levels which had declined the previous 4 days as shown below:
2015 03 02 18 4 3 4 4 3 3 3 1 60 3 5 8 6 5 4 3 1 28 4 4 5 5 4 4 3 2
2015 03 03 10 3 3 2 2 2 2 1 3 21 1 2 3 6 5 1 1 2 11 3 3 2 2 2 1 2 3
2015 03 04 9 1 1 1 3 3 2 2 3 12 1 1 1 5 4 1 1 1 10 2 2 2 3 3 1 2 3
2015 03 05 -1 0 0 0 1 3 2-1-1 -1 0 0 0 3 4 2-1-1 7 1 1 1 2 2 2-1-1
This point where the gateway solar wind speed meets the declining KP usually creates a stronger dow.
One of the interesting thins is the Solar Wind Transit Time line was less disturbed, on March 4th, 2015, which usually means a stronger dow.
We were also in a stage #2 cycle, where the dow jones is naturally stronger as shown below:
So in conclusion, the dow was stronger due to the declining KP, smoother solar wind transit time and the entry of the solar wind speed into the 420 range.
Late Wednesday Afternoon on March 4th, 2015, there was a mild condition yellow, which boosted the solar wind speeds upwards to around 500. This now fully takes it out of the 420 - 430 gateway harmony solar wind speed.
The real turning point in accurately predicting this forecast is the solar flux had dropped significantly the last 48 hours (as pictured below). This behavior is similar to the action caused by the long term solar flux dropping. This means we have uncovered a 2nd means of momentum. This small loss of momentum in the mini cycle is similar to the drop in the long term solar flux. Whenever this happens, the momentum from the previous day, especially the dow jones carries on through to the next day.

The forecast is for the dow jones to be weaker or to close lower between 30% and 40% on Thursday March 5th, 2015.
Solar Factors Influencing the Weaker Dow Jones on Thursday March 5th, 2015.
Current Solar Wind Speed is 460.9 as of 12 p.m. March 4th, 2015 - due to the full moon which makes the solar wind speed more constant rather than slowing it down, 460 is out of gateway harmony range with the solar wind speed forecast to remain high.
X-Ray Background Levels have been at high levels (above 4.0) the past few days
Predicted 3-hour Middle latitude k-indices shows KP at a peak low (no motivative energy)
Solar wind speeds are out of harmony range
Dow was very week on Wednesday March 4th, 2015.
Full Moon
This forecast matches the chart titled "cycle" Towards end of cycle #2 as well as the charts titled:
"Cycle #2 Momentum" and "Solar Wind Speed "Hovering"" with sub charts related to volume swings.
Air pressure and dst are lower.
2mev's are forecast lower
x-ray background flux is at 5.2 from mondays high of 9.4.
We are entering a cycle #2, phase with high solar energy winding down.
Even though these conditions appear to be a strong condition green phase, the lack of KP, as well as the solar wind out of the 350 range show a weaker dow.
If the solar wind speed would have entered 350 on Thursday with a slightly higher KP, the polarity would have changed from a weaker dow to a stronger dow. However with the weaker dow on Wednesday, this trend will likely continue on into Thursday.
View our New Page
A step by step guide of how I arrive at my dow forecasts
The forecast is for the Dow Jones to close approximately 60% higher on Monday March 2nd, 2015
On Monday March 2nd, 2015, the Dow Jones Closed Up 155.93 (0.86%). 16% above our forecasted rise as we originally forecasted a higher dow between 30% and 60% higher. However our forecast for the dow jones to close higher or be stronger on March 2nd, 2015, was 100% correct.
Analysis of the Dow Jones for the forecast for the Dow jones to close higher or show stronger activity on Monday March 2nd, 2015. Our forcast was for between 30% and 60% higher.
This was 1 of 2 override periods. This is the solar flux override period. At the first rise in our suns solar flux levels after the X-ray background solar radiation levels have been quiet and below 4.0 for a number of day, just as the suns solar flux activity starts increasing, (which is the first rise in activity shown by the visual red line), and there are higher 2mevs forecast, ---- this phase of solar activity has the same override of general minor solar indicators as when the solar wind is declining and first entering the speed/range of 350.
The high energy that creates this override comes from the higher or increased kp levels. Which over time has built itself up into a "bubble" of energy and is released whenever the solar wind speed enters the gateway harmony speed entry points and first crosses the 4.0 X-ray background flux threshold.
As the solar wind speed or X-ray background flux levels continues to increase a negative period sets in. This is called the "agitation" period where solar wind speeds out of the gateway range combined with an increased x-ray background flux level causes a weaker Dow jones, this is further amplified when kp levels are forecast at above higher than average levels.
As this process continues, a new stage forms which I call "normalization".
Normalization is a phase where solar wind speeds are at high speeds for 3 or more days and x ray background levels are still at high levels, as this continues the markets begin to adjust and normalize to this high energy.
The revised forecast for the Dow Jones to close approximately 60% higher on March 2nd, 2015, is based on the following solar weather conditions: (This shows the importance of checking the solar weather 24 hours before posting the forecast.)
The below images are snapshots of solar weather taken on March 1st,, 2015


Solar Wind is entering 1st harmony gateway of 510
2mev's stronger
x-ray background flux first rise above 4.0 - this is due to the first rise in sunspots after a quiet period for a number of days.
kp in decline
solar flux line first activity in days. This overrides any negative conditions with the same power as the first solar wind speed entry into 350.
As of March 1st, 2015, the solar forecast has been revised. We are in a strong condition blue (override with conditions similar to a strong 350 solar wind entry for the first time).
Special Notes for the forecast on March 1st, 2015:
Entering the end of a long term solar flux (momentum)
Aggrevative KP Forecast for March 1st
This aggrevative KP as well as solar flux peak will create momentum that will spill over onto Monday, thus possibly creating a weaker dow or for the DOW to close lower on Monday March 1st, 2015. Check back Sunday evening for any updates/revisions.
X-ray background flux as well as visual red solar line flux is flat or no activity, meaning major normalization is occurring. No solar simulation or motivation in the markets are showing. And the dow closed lower on Friday, indicating this momentum will continue through to Monday also 2mev forecast for Monday is for a continued decline throughout the weekend onto Monday with no increase in 2mev levels. We are also approaching a full moon w/high speed solar wind speeds forecast.
Solar Conditions as of Saturday Feb 28th, 2015
This is too rapid a rise in solar wind activity for normalization to take place
Transit time more rough
Wind speed at high levels forecast
Current solar wind speed on Saturday at: 457.6
Visual Solar Flux Line Stronger with first increase in activity for some days
Sunspots Increasing and X-Ray Background Flux Increasing
Electron Flux Line just showed major disturbance
_____________________________________________________________________________________________________________
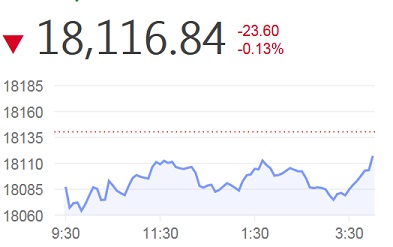
Analysis of the Dow Jones forecast which was forecasted to close lower on Monday February 23rd, 2015.
On Monday February 23rd, 2015, the dow jones closed down -23.60 (-0.13%). Thus the forecast was 100% Accurate.
Due to moderate / minor solar activity no major motivation/stimulation occurred causing a low dow swing to occur. If the solar wind had entered the gateway harmony speed, the strength of the swing would have been moderate with the dow closing higher.
There was a condition yellow late Sunday evening, which not only locked in the microclimate switch, but caused the solar wind to fall out of gateway harmony range to over 400, but not at the 420 to 430 next stage up gateway harmony window. X-ray background flux levels on Sunday were 3.0 and on Monday the visual solar flux line was flat. These low levels of X-ray background levels were also responsible for the lack of solar stimulation/motivation.
Also the microclimate switch point was on Sunday, at which early Sunday the solar wind speed was around 270, until the condition yellow which occurred later on in the evening.
The condition yellow was strong enough to increase KP levels, which were forecast as aggregative on Sunday.
The forecast for a weaker dow jones or for the dow jones to close lower on Feb 23rd, 2015, is based on the following solar weather observations.
This appears to be a period of a strong condition purple
KP levels same last few days. No major spike
KP forecast stronger for Monday the 23rd of Feb 2015
BZ position south and more disruptive (solar wind transit time)
Visual Solar Flux Line Dead Flat
X-ray background at 3.3 with no major s. optical or c. class occurring
2mev's are forecast to not increase on Monday feb 23rd, 2015
Long term solar flux line is starting to go onto the long term solar flux increase trend
Solar wind speed has been on a long term decline the last few days with the chance for a condition yellow to occur (red)
Solar wind speed is about 300
Solar wind speed forecast is for lower speeds
KP forecast is aggregative
There is no major KP spike for Monday feb 23rd, 2015
As far as the mini cycle goes we are at the peak (red), or normalization occurring
Because we are at such a low level of solar activity, more attention is brought to the metrological conditions.
Also there is not a predicted gateway solar wind harmony window for Monday Feb 23rd, 2015.
Therefore due to almost no solar activity forecast, and metrological mostly in the negative a lower dow is forecast for Monday Feb 23rd, 2015
Metrological conditions
Goes electron flux line disturbed
CP 0.2
Cosmic rays lower
DST in the lower range
Added February 21st, 2015
Z = Y + Q = X = O and R
Where Z represents the overall cauldron or chamber of energy that builds up in pressure that is gradually released affecting human emotion and/or perception including the markets or those markets showing the most productivity gains. This is represented shown and expressed by X, or the end result.
Q represents subcomponents of the various energy spectrums (X-ray background flux, S Optical and C. Class etc.) and of in Y, and which are gradually contained in Z and whose effects are felt / observed in X.
Where O represents the pressure building and R the pressure being released or descending.
The varying energies expressed by Y are dependent on the factors in Q
S X D & D
Where S represents the stock market and D represents cycle 1 and G and Cycle 2. This is related subcomponent to O and R.
D is dependent on the amount of energy contained by Y and G is also dependent on Y.
This is a related subcomponent to O and R.
D is dependent on the amount of energy contained by Y and where at certain times, the energy levels of Q will fluctuate to cause a swing or change in the Dow from higher to lower and vice versa.
Z = Y (squared) + Q = F & H = AZ
Where Z represents the vat or cauldron of emotional energy. Y (Squared) the increase in energy and Q, the increase in S. Optical or C. Class energy and Q the subcomponents.
F. Represents the stronger Dow and H the weaker Do.
AZ represents the polarity switch or change in the direction of the dow jones from high to low or vice versa.
The strength of the DOW
F & H + G + V + W = J (Squared)
Where F and H represent the Dow and G represents cycle #2.
This is partly based on W, which represents the dow position the previous 24 hours.
V is based on the momentum, which is caused by the start of the decline of the solar flux after it has recently peaked. This momentum also can serve as momentum in the direction of the dow jones.
J (squared) represents the energy to create a strong swing or the strength of the drive for the direction of the dow.
Thus the expression of Z contains within it a poliarity which after being built up by Y, changes its polarity due to factors determined by Q.
Polarity switches occur most common when the solar wind speed is out of gateway harmony ranges and the cycle has "normalized".
The high levels of Y (squared) with Y (squared) representing a major increase in energy levels caused by O.
The gradual build up of energy are responsible for the polarity switch, which thus causes a new direction for the dow to flow.
F & H = T and T (squared) + Q or Q (squared) = F or H.
Where the dow jones high and low or weaker or stronger dow jones is affected by the sun's solar wind with T representing the solar wind harmony gateway entry speeds and T (squared) representing the out of gateway solar wind speeds.
J (squared) can be determined by the factors occurring in Q and the amounts of energy supplied by Y.
If the x-ray background flux levels are at a high level, (a subcomponent of Q), represented by Q, and T is present it will cause a stronger J (squared) reaction. This can be further enhanced by higher levels of Y (squared) represented by Q (Squared) = Major Swings.
With Q (squared) representing high energy levels caused by Y (squared)
___________________________
The polarity switch
The more S. Optical and C. Class flares, the sharper or more abrupt the polarity switch or swings in the dow or changes in the weather, especially if it occurs during a cycle #2, when this energy is "depressurizing"
This pressure or "vat" of built up energy is released via "polarity" switches in "stages", causing swing cycles to occur in the dow.
The cycles
Each solar flare mini cycle contains within it "sub mini cycles" which are determined by microclimate weather changes. When a polarity switch occurs, a new sub mini cycle begins, which then ends / begins at the next microclimate switch point.
KP Energy
KP has 2 behaviors in Z or the "Vat of emotion". 1: It acts as a previous memory from the past and 2: it motivates or "re-motivates" energy/behavior from the base creating and guiding the cycle.
The forecast is for the Dow Jones to close lower on February 18th, 2015
On Wednesday February 18th, 2015, the dow closed down 17.73 (0.098%). On this day our forecast was 100% Accurate.
Analysis of the forecast for the dow to close lower on Wednesday February 18th, 2015.
This was an excellent example of an absence of solar activity contributing to a lack of motivation and expectation in the markets, due to low solar wind speeds and almost no sunspot activity. The dow closing lower the previous day gave us clues to a weaker dow occurring on the following microclimate switch point day. On the forecast day the solar wind did jump to over 400, which is out of the gateway harmony range. Also it appears that when the x-ray background flux levels are at 4.0 or below, that the metrological conditions are more accurate.
The forecast for the Dow Jones to close lower on February 18th, 2015 is based on the following solar weather conditions: This forecast matches the chart below titled "350 solar wind speed" however because by wednedsay the 350 will have passed, a weaker dow is forecast. A condition yellow on Tuesday february 17th, 2015, pushed the solar wind up to 350, causing the dow to close approx 16% higher. Because there is no increased solar flux forecast, higher optical or higher KP on Wednesday febraurary 18th, 2015, there is not enough momentum built to continue the dow to close higher on wednesday Feb 18th, 2015. Because the long term solar flux has not peaked, there is also a lack of momentum. We are also at the start of a new cycle starting, in which the solar wind is forecast to "bounce" far above the 350 range in the coming days. This lack of momentum and the wind headed below 350 causes 'normalization'. Also the solar wind speed is forecast to drop below 350 on Weds. solar weather conditions:
Solar wind steady
Disruptive entry showing
Forecated to jump to high speeds in next 48 hours
Current Speed: 350.0
Previously jumped to 370 and declining into 350 by late Tuesday afternoon
These next 2 show no power for Tuesday
X-ray 3.6
Visual solar flux line flat
2mev forecast lower
Metrological conditions (all in red range)
GOES magometer very disturbed
CP at 2.0 (red)
Cosmic rays lower
Air pressure rebounded
THERE IS NO KP RISE FORECAT FOR TUESDAY (NO MOTIVATION)
CURRENT KP AT MID TO LOW AGGREVATIVE LEVELS
We are also at a new moon, which means the solar wind speed will drop more rapidly than usual.
A stronger dow or for the dow to close higher (in the 10% range) is forecast for Friday February 13th, 2015
Analysis of the Dow Jones Industrial Forecast for Friday February 13th, 2015
On Friday February 13th, 2015, the dow closed up +46.97 +0.26%. (close to our original calculation, but off by 10% in the closing higher forecast). However our forecast was 100% correct in stating that the Dow Jones Industrial would close higher on Friday February 13th, 2015.

The reason the dow closed higher on this date was due to the following solar weather conditions:
The solar flux was ½ way into the decline, causing previous momentum from the dow the day before which closed up above 80 points. This momentum carried through to Thursday. During the last 3 days the x-ray background flux declined to the 4.0 X-ray background flux range, a time of decreasing fear and harmony. As shown in the image below the x-ray background flux levels.

br> By Saturday, which is the microclimate switch date, the solar wind enters the gateway harmony speed of approximately 270. Because there was a very, very small KP peak on Saturday, this caused the dow to close only 40 points up, which is 10% above our original forecast, this means that the dow is health during this cycle.
Also there were many positive metrological indicators, enhancing the forecast accuracy.
As shown in the model, as the KP peaks on Saturday, this emotional momentive energy bounces back through time to the previous day (Friday). And in most cases when the conditions are right, if a microclimate switch is on a Sunday, the momentum will carry through to Monday.
We are off cycle (less frequency strength), however because our insturments are getting better we are going to plot a forecast for Friday February 13th, 2015. The new cycle starts on Monday February 16th, 2015.
This forecast matches the chart below titled "Strength of the Swing of Dow Volume"
KP levels flat
solar wind forecast to decline or "flat"
2mev forecast stronger
exact solar wind speed is 317 and declining
visual flux line flat
X-Ray dropping
NORMALIZATION OCCURING
very, very small KP rise on saturday
NO Aggrevative KP forecast
Electron flux line steady
DST, Cosmic rays higher
CP out of 0.2 range
BECAUSE THIS IS THE PHASE JUST BEFORE A CYCLE STARTS, IT MAY BE THAT METROLOGICAL DETAILS HAVE MORE PRECIDENCE DURING THIS PERIOD BEFORE THE CYCLE STARTS
The 4.0 Entry Cycle of Harmony
The X-Ray background flux behaves similar to the sun's solar wind. It exhibits "gateways of harmony" much like the solar wind speeds of between 260 to 280, 350 etc.
One powerful x-ray background flux entry point is when the background solar flux enters 4.0, after it has been in decline for 2 or more days, much like the solar wind as it slowly declines towards 350. This decline into 4.0 is strongest during the 2nd cycle of the mini-cycle. This phase creates a stronger dow jones.
The opposite is also true, during Cycle #1, as the x-ray background flux goes above 4.0 for the first time, a "shock wave' occurs within the first 48 to 72 hours as it increases in value. If the solar wind speeds are out of the harmony ranges during this time, it will create a weaker dow jones.
As the solar wind enters this range in cycle #2 (see fig 1 image below), it can override the microclimate switch day if the solar wind is entering 350 and the microclimate is occurring within 24 to 48 hours. View Link for below image

This strong green during cycle #2 will be amplified if the x-ray background flux is stronger and the visual red solar flux line is more active.
What is happening is that as the solar flux long term peaks and goes into decline, even up to 48 hours later, as the x-ray backgruodn flux enters 4.0, the previous dow momentum from the day before carries on through to the next day.
Why our forecast was accurate on Tuesday February 11th, 2015.
A weaker dow or for the dow to close lower on n Tuesday, February 11th, 2015 was forecast. On Tuesday February 11th, 2015, the dow jones closed down 6.62 points. As we can see from the chart below, the dow jones was weak throughout most of the day, going as low as 90 points at some parts during the day. The reason for this was because there was a microclimate swtich date, it reversed the polarity of the energy the day before. On Monday, Feb 10th, 2015, the dow had closed higher in the medium range. This lack of energy was caused by a visual flat line solar flux and high x-ray background levels. Also KP levels were extremly low or non-existent (no motivation). Metrological values showed the following:
CP values lower (red) Cosmic rays lower (red) DST lower (red).
However one major key to all this was the high energy cycle had ended, which had stated in late january. This ending allowed the solar wind speed to drop to below 350 on the microclimate switch date.


The forecast for a weaker dow jones on Feb 11th, 2015 is based on the following solar weather observations.
This is the first entry into 350 after the condition yellow a few days ago, making for a strong green. This green energy was expended on Monday Feb 10th, 2015, as of Tuesday morning the solar wind will have declined past the 350 mark.
Current Solar Wind Speed: 356.9 (green)
2mev forecasted stronger (blue)
Visual Solar Flux Line 㦬atä ¨purple)
X-Ray Increasing (red)
Sunspots Decreasing (red)
A Very, very minor KP spike predicted (green)
CP values lower (red)
Cosmic rays lower (red)
DST lower (red)
KP forecasted levels as non-aggregative (green)
Expect a weaker dow jones or for the Dow Jones to close lower Monday February 9th, 2015
On Monday February 9th, 2015, the dow jones closed down over 95 points. Therefore our forecast was correct for this date
The forecast a weaker dow jones on February 9th, 2015, is based on the following conditions.
There was a microclimate switch point on Sunday and a condition yellow on Sunday (higher KP), so this momentum of negative solar energy will carry over onto Monday.
There was a condition yellow on Saturday night/Sunday morning. This caused the solar wind speeds to increase, as well as cause increased KP activity.
Air Pressure rebound is at extremely high levels, lower dst and cosmic rays, CP is approaching 2.0
Current Solar Wind Speed is 500.6, with a forecast for a decline. Because it has dropped past the 510 2nd gateway mark, the speed of 420 won't be reached until Tuesday February. 10th, 2015.
The Energy Flow
The most dramatic swings of the Dow Jones occur during periods of higher KP activity. We can make this energy flow eaiser to imagine if we picture in our minds the emotions that drive the markets.
All these emotions make up what I call the 㣯llective matrixä® This emotional matrix is made up of a huge ball or 㶥sselä ¯f motivational energy, that must be releasted at some later date.
This 㶥sselä £ontains within it its own nervous system or 㬩nes of energyä ´hat run throughout it. This is much like accupuncture points that an acpuncturist uses to re-start the energy flow of the body to release pain or cause the body to heal itself.
We can visuzlie the solar wind speeds at their special entry points of 270, 350, 430 510 510 590 670 750 (which are 80+ from 350) as being the stimulation pressure points. When they are stimulated, they cause the dow to close higher.
The energy force that stimulates these acupuncture pressure points is the KP activity when it begins to rise or become more active. This causes the energy to re-flow, creating more activity in the markets, creating a stronger dow jones.
When there is no KP or it has been 4 or more days after a period of high/stronger KP activity, this energy stagnates and the dow closes lower, especially if the solar wind speed is above 350 or out of the ã°²essure point stimulation rangeä® This weaker dow is caused because the acupressure/energy is being applied in the wrong areas.
This cycle than continues to repeat itself, bringing balance to the markets.
Added February 7th, 2015
Below is an image related to our analysis of the forecast on Friday February 6th, 2015

As predicted it is now Saturday February 7th, 2015 and the Solar Wind Speed did not approach the gateway harmony window of 350 (We are still at 400) . The weather microclimate change did occur today, however there was no KP spike or peak.
Does this mean that a peak or spike in KP is key to accurate forecasting? Perhaps KP rules collective motivational behaviour and because the previous week it was at extremly high levels than finally "died" down by the end of the week.
It is a fact that at higher S and C class Optical levels weather changes are more prevalent and occur more strongly. This is also reflected in the stock markets and activity. As this optical leevl declines, so does the swing of the dow, up or down.
When KP levels start to go flat around this time, the microclimate switch can occur, however if no KP spike is present, the previous strong dow will become weaker, especially if the solar wind is not forecast for the 350 speed at the forecasted microclimate date.
This "hovering" at the 400 solar wind speed is not uncommon after a previous period of higher solar activity. This is a good sign, because energy is building and when the solar wind hits 350 in the coming days, the poliarty will change again to a stronger dow jones again.
So it is key that while the solar wind "hovers" at 400, as it is as of February 7th, 2015, to pay attention to the solar wind forecasting for the exact day it hits 350.
It is the KP peaks at the microclimate switch point dates that create the weather changes, especially if S optical and C class flares are higher.
To add to model for Future Observations:
After approaching a period of strong KP and it has "died down", leadiang to a stronger dow jones, than if there is no rise / spike in KP at the microclimate date as the solar wind is approaching 350, and if it is "hovering" at 400, to pay attention to the solar wind forecasting for the exact day it hits 350.
We forecasted a stronger dow for February 6th, 2015, however on Feb 6th, 2015, the dow closed down -60 points

One very interesting observation about this forecast, was the KP activity did not peak or show stronger activity on Saturday Feb 7th, 2015, possibly leading to less motivation in the markets, causing the dow jones to close lower. This would mean that the first decline in KP after strong activity for the first 3 days has the most pronounced effect, much like the solar wind first declines into the 350 range. Perhaps in the future forecasts without a peak in KP levels, or just after stronger KP activity and KP levels start "normalizing" and there is a microclimate switch date occurring, forecasting will be avoided. The tricky part about this forecast is the solar wind has not entered the 350 range and was forecast to stay just slightly ahead of this wind speed on Saturday, meaning that we missed this small detail.
The dow was stronger the first half of the morning, than became weaker. It appears that normalization works both ways. In that after a strong period of good solar wind speeds, the energy for a stronger dow starts to fade. Solar wind speeds stayed stable around 400 on this date, and the 2mev's were forecasted lower. This means that the condition blue had not come about, even on Saturday. So we can expect a solar wind speed above 350 on Saturday. Future forecasts should pay attention to the solar wind speeds 48 hours in advance and if the 2mev's are forecasted lower.
The forecast for the dow to be stronger, or close higher on Feb 6th, 2015, is based on the following solar weather conditions:
Microclimate switch point is on Saturday, so energy bounces back through time, manifesting on Friday the 6th of Feb 2015.
Solar wind forecast continued to decline
Current Solar wind speed 392, with a possible decline into the harmony gateway window of 350 by Saturday
Long term solar flux decline has ended, now heading into a long term solar flux rise.
This is going to send the solar wind speed into a very slow decline with a positive exact 350 by saturday.
2mev forecast stronger
KP levels are forecast at same KP levels, however Kp does not count as we enter the strong 350 harmony gateway entry point by Saturday.
DST is higher
It appears that DST has more relevance at the solar wind gateway entry harmony points. As long as the solar wind does not "jump" unexpectedly (condition yellow), this forecast should remain accurate.
Analysis of our forecast for the dow jones to close higher on Jan 4th, 2015.

Our forecast for this date was for the dow jones to close higher on this date, of which it did. The day before and after this forecast the dow jones was also stronger.
Microclimate readings were stronger/rising cosmic rays, a strong rebound in air pressure and a more quiet GOES magnetometer and just after higher optical.
It may be that the above microclimate readings are more accurate when KP levels are cooling down.
Xray background flux levels were the following: Feb 1st, 7.0, Feb 2nd, 6.8, Feb 3rd 7.8 and Feb 4th, 7.5. So they were above 4.0, giving the strength of the green entry point more energy.
During this forecast position, we are in a period of extreme high solar wind speeds, of which “normalization” has occurred or that the shock of the high speeds has passed.
It was also a period where KP levels “cooled down”, much like our sun’s solar wind cools down towards the 350 range creating a stronger dow jones.
This means that our earth has a “cooling down” effect, much like our sun’ solar wind. This is KP cooling down period is strongest after extremely high periods of KP activity, which are the most common from September to November and again from January to April. Below in the image we can see that the KP levels were becoming less stronger or "normalizing" much like the solar wind does as it enters the 350, 510 ranges etc (see below).

Information courtesy of NOAA
http://legacy-www.swpc.noaa.gov/ftpdir/indices/old_indices/
Another clue to this KP cooling down effect is to watch the long term forecast for when a KP decline is forecased as shown below.

Another observation during this forecast was a condition blue occurred. This is because the intervals of the solar wind entry points into more harmony of 350, 510 etc. also coincided with an increase in the visual red line of the sun’s solar flux,as well as an increase in the sun’s 2mev levels on Feb 4th, 2014. This is the start of a condition blue, or the start of a long term increase in the sun’s solar flux levels. This means that condition blue periods can also occur at higher solar wind speeds when they are at the 350 gateway entry speed points.
Also after much observation of the CP readings in the microclimate range, it appears that when the CP values reach 0.2 and are dropping that is the most accurate window for a weaker dow, not below 0.2
Because we are at higher solar wind speeds on Feb 4th, 2015, this makes for a more challenging forecast. So we are going to base this forecast on "normalization" meaning that after a period of the solar wind being at high speeds for a number of days, "normalization" starts to occur and the "shock" passes, leading to a stronger dow and more harmony.
As of Feb 3rd, 2015, we are dropping down from a long term solar flux high. This means that previous momentum from feb 2nd and 3rd (stronger dow) will manifest on the 4th of Feb.
Solar wind forecast is into a decline towards lower speeds
Current solar wind speed is: 532
2mev forecast stronger
visual solar flux line is just starting out with more activity (blue)
We are coming down from a previous high of high KP activity and into a lower period of KP activity (normalizing green)
Cosmic rays are stronger
Air pressure is rebounding
Goes electron flux line is not as disturbed, after being severely disturbed the last few days.
2nd Gateway Harmony Entry Points of our Sun's Solar Wind
The gateway entry points of harmony rise in multiples of 80 upwards, starting from the starting solar wind speed of 350.
350 - 80 = 270
350 + 80 = 430 - STRONGEST POINT
430 + 80 = 510 - Entry Point on Wednesday February 4th, 2015
510 + 80 = 590
590 + 80 = 670
670 + 80 = 750
Current Solar Weather conditions as of Feb 2nd, 2015.
Solar flux energy is dying down as shown in the cycle calendar
Solar wind speed is at 680, a record high for this year
Optical at 7.0 and rising
Sunspots are at a high.
Solar flux visual line is flat
2mevâ³ increasing
KP Aggrevative at high levels
Today KP record at high
Scientific Verification Regarding the Sun's Solar wind and the Markets
Do Our Sun and Stock Market Share a Rhythm. Article by NASA
Astrophysicists at the University of Warwick have applied data analysis methods used to model stock market fluctuations, to explore changes in the solar wind (the sun's expanding atmosphere). They have discovered that the fluctuations in the solar wind follow the same kinds of patterns seen in the stock markets -- particularly when it comes to the number of extreme events or large fluctuations.
http://solarsystem.nasa.gov/news/display.cfm?News_ID=3174
The Solar Winds Effect on the U.S. Stock Market. Research Article by Time-Price-Research.
http://time-price-research-astrofin.blogspot.com/p/solar-activity-markets.html
Geomagnetic storms and stock market returns. Research article by Astro Trading.
http://www.astro-trading.net/2011/01/geomagnetic-storms-and-stock-market.html
Stock Market Swings Help Researchers Understand Extreme Events In Solar Wind
http://www.sciencedaily.com/releases/2002/07/020726081058.htm
Equation for the exchanging of information between two universes
When the dow closes lower in another universe, the dow has closed higher at the same time. We live in a multiverse where information is exchanged via wormholes in the form of high energy. This is much like uses of the Internet exchanging information between each other. This means that information travels through these portals in the form of energy and at specific dates/times this information can be accessed. Why travel physically through a wormhole and risk death when you don't have the adequate equipment when you can retrieve information. Information in our universe is shared between the multiverses that we co-exist with. Because the solar wind is exchanging information between alternate universes, we must exist in a multiverse in which information exchange takes place via polarities, much like the polarity of a magnet. These polarities change in value, much like a magnet changes from north to south and south to north. It is a fact that earth has changed its polarity from north to south and south to north over the past few million years, surely the magnetic field of wormholes also change their polarity.
Formula:
A & B = Z where A represents our universe and B, the wormhole. With Z being the second universe. Where Z = A and B + X with Z being the second wormhole and X being the multiverse, representing an infinite number of universes. This information exchange occurs simultaneously between all universes causing universal harmony and balance to occur.
Where Z = I + A & B with I being the conduit that gives the information its information pathway causing the exchange of information between universes. I is much like a copper cable wire used to send information between telephones.
Wormhole Opening and Access
C + D = E. Where C is the wormhole opening and D the date/time the wormhole opening takes place. C + B (B = wormhole) where E is the information extracted/interpreted from B (wormhole). This information comes from the multiverse (x) and is shared between multiverses, causing balance to occur between events via the exchange of energy/information.
The forecast was for the dow jones to be weaker on Friday January 30th, 2015. On Friday January 30th, 2015, the dow jones closed down -251.90.
Analysis of the January 30th, 2015 forecast.
This forecast is especially significant because the dow had closed up over 200 points the previous day, than dropped down over 200 points on our forecast day.
There was a very high X-Ray background level of around 9.0 during this polarity switch at the microclimate switch point date.
 This peak in KP activity that occurred acts much like the guitar string “plucking effect” that occurs with the sun’s solar wind (see further text below for more info) as it enters the 350 range and is especially stronger when it has not entered the 350 wind range for a period of days.
This pattern also repeats itself during times of peak KP activity. If KP levels have been quiet for some time, or a number of days, when a peak in KP levels re-occur, it has the same impact as the solar wind.
This KP striking effect creates as weaker dow when the sun’s solar wind speeds are at high levels, usually above 350, and the solar wind speeds have been at these high speeds for a number of days.
Just as a quiet and still solar wind has remained quiet for a number of days, when it enters the 350 solar wind speed from above or below it creates a stronger dow jones.
A peak of KP activity that is aggregative with high speed solar wind speeds create a similar “shock”, only this time the dow jones is weaker.

Microclimate switch points are the activators of these changes in the polarity of the dow jones or they can amplify a given condition, depending on the solar weather conditions. This is because our weather is influenced by the sun and people are affected or influenced by our weather.
Because the microclimate swtich occured on Saturday, the energy bounces back through time and manifests on Friday, as it did on January 30th, 2015.
The forecast for the dow to close lower on Friday January 30th, 2015 is based on the following solar weather conditions:
KP Peak on Saturday
KP Peak is aggrevative
Major KP storms starting late Thursday
Predicted solar wind for next 24 hrs increase
Current solar wind speed at 414.8 with forecasted increase by Saturday
Approaching full moon. Higher solar wind speeds last longer
Approaching mars aligned with sun
DST slightly lower
Dow Forecast analysis summary for January 26th, 2015
 The reason the Dow Jones closed weaker on January 26th, 2015, is that the solar wind had not declined low enough and long enough below the 350 range.
Even though it was near the 350 range on Sunday, the previous few days it had not reached a low long enough to create a strong enough beneficial “shock”.
The stronger energy of the 350 range or stronger dow jones is reached after the solar wind has not reached 350 for a period of time.
This energy is much like a musician who has let the guitar string resonance fade after not plucking the string for a while. The resonance fades over time.
Once the guitar string is re-plucked after a long pause the note than returns stronger and more clearer.
The more time that elapses between the solar wind re-entering the 350 range, the stronger the beneficial “shock” or stronger dow when it re-enters the 350 range again.
The forecast for a weaker Dow Jones on January 26th, 2015 is based on the following solar weather conditions
Is based on the following solar weather conditions
Higher Speed solar winds
Monday is a microclimate switch date
KP levels are forecast to be aggregative
The 350 solar wind speed entered on Sunday, running its course.
The dow jones is expected to close lower on Jan 22nd, 2015.
On Jan 22nd, 2015, the dow closed up over 110 points.
Lessons Learned from this forecast: Because the sun's solar flux had been lower for over 48 hours, with very low sunspot activity, the increasing solar activity created a "condition blue" period, which caused a stronger dow jones. This energy, had the same power as the 350 wind position, overriding KP values and the higher solar wind speeds. Therefore we now have two positions that can override higher aggregative KP levels, the first increase in the solar flux and the solar wind entering 350. The condition blue phase is a constant dow jones increasing element. Future forecasts will take this new parameter into effect. The microclimate weather change always increases the amount of the dow movement higher or lower. The microclimate switch point change always coincides with an increase in KP levels. Also on this date of the 22nd, DST levels rose for the first time in almost a week.

If the sun's solar flux had been more active 72 hours before Jan 22nd, and there were more S. Optical (sunspots), then this increase in solar wind would have caused a lower dow jones.
Solar Flux Link:
http://www.solarham.net/xray2.htm
Continued Analysis from the Dow Forecast on January 22nd, 2015.
This condition blue was very short lived due to the higher speed solar winds and the aggregative kp which occurred on Saturday at which the energy was reflected on Friday.
On Friday January 23rd, 2015, the Dow Jones Clo sed Down over -144 points. We missed our forecast date by one day. However here’s why:
If we look at the solar flux visual for Friday, it has died down and the Long Term Solar Flux Peak has passed
Because the solar winds were still at high speeds and the KP levels on Saturday were at higher aggregative levels, the energy bounces back to Friday. This caused the Dow Jones to close lower.
Furthermore, an excellent indicator of lower solar flux and lower optical would be a drop in the long term solar flux levels.
The Solar Wind Energetic Cross Points
X-Ray Background Levels declined the last 3 days to the 4.0 range (shown bellow). These are the ranges for health and wellness. If we look at the Dow Jones forecast for the 22nd of January 2015, we can see that at the first increse in the solar wind as it crossed the 350 cross point, the X-Ray background levels were at favorable levels.
br>

One way to look at this is to visualize the sunspots being like the hand that plucks a guitar string creating a resonance or musical note. These notes are sometimes soothing and healthy and at other times uncomfortable and unhealthy.
The solar wind speed of 350 is the more soothing note and the winds above this are more uncomfortable.
At times the solar wind may remain at speeds above 350 for a number of days. When this occurs the uncomfortability ceases and a normality returns.
If we visualize the sun’s solar wind at high speeds for a certain period of time being unhealthy to our immune system, than after a period of days this “shock” affecting the body’s immune system eventually loses its unhealthy shock. The body builds up enough “anti-bodies” to fend of the unhealthy invaders.
During the higher solar wind speeds, the KP levels and forecasts can give a more accurate forecast of where the dow jones is going to be. In most cases the dow jones is weaker and health is also affected.

This shock also works in the opposite direction. At the first increase of the sun’s solar flux activity, when the X-ray background levels are in the favorable range of 4.0 and sunspots are strong and the solar wind passes through the 350 mark, it creates a stronger dow. A time where people’s confidence and perception is upbeat and positive. This effect is so strong it overrides the negative aggrevative effect of higher KP activity.
The next beneficial strong effect where the dow is also stronger is when the solar wind once again enters 350, but on its decline. This overrides aggrevative KP levels and higher X-Ray background levels. The cycle than repeats itself all over again.
The forecast for a lower dow jones or for the dow jones to close lower on January 22nd, 2015 is based on the following weather conditions.
Current Solar Wind Speed is
Sunspots, including Optical are dropping
Solar Wind Speed is between 438 and 450
Visual Solar Flux Levels are increasing
2mev is forecast to increase
SOLAR WIND JUMPED LAST 24 HOURS
SOLAR WIND SPEED FORECAST TO INCREASE NEXT 24 HOURS
Long Term Solar Flux is going into decline
KP is forecast for aggregative levels
Goes Electron Flux line is more disturbed
Air pressure rebounded
CP Values dropping below 2.0
Cosmic rays in decline
Solar Wind Speed Forecast to Increase
The forecast is for a weaker or lower dow on Friday January 16th, 2015.
The forecast for the Dow Jones to close lower on Friday January 16th, 2015 is based on the following solar weather:
The solar wind "jumped" on Thursday the 15th, 2015 into higher solar wind speeds. CP Values are in the strong 0.2 range and DST values are lower. X-Ray Background Flux Levels have been rising the previous 2 days in a row and are now at B9.1. Also the long term solar flux is peaking, causing the lower dow momentum to continue.
On Friday the dow jones closed up over 150 points..
Because the microclimate weather change occurred on a Saturday, the energy bounces back to Friday, which is common when the 350 enters this range.
Lessons Learned: The solar wind entered the 350 range causing the dow to close higher, overriding all the minor indicators of a lower dow such as CP values etc. The new moon also made the solar wind drop faster than usual. Also the long term solar flux peak has been completed on the 15th. This is an excellent clue to the polarity change in the solar wind.When the long term solar flux has peaked and is just starting to drop, a polarity change in the sun's solar wind to 350 is about to occur. This means that the drop in the sun's solar flux could mean cooler solar wind speeds ahead. More attention is now going to be focused on predicting accurately the future solar wind speed and applied to future forecasts. This is the more challenging part is knowing when the solar wind is about to enter the 350 range. If this accurate solar wind speed forecasting entering the 350 range can be obtained than our accuracy will be greatly enhanced.
So far our research has confirmed 2 accurate windows:
1: The first entry of the solar wind after being at high speeds into the 350 range as soon as the first weather change takes effect causes the dow to become stronger.
2: After the first "jump" of the solar wind into high speeds above the 350 range at the first change in the weather causes the dow to become weaker.
BELOW ARE THE NEW LINKS RE-ARRANGED TO REFLECT A MORE ACCURATE EARLY FORECASTING SYSTEM OF OUR SUN'S SOLAR WIND.
|
Our Sun's Solar Wind http://www.paradiseexcursion.com/solarwind.html http://www.paradiseexcursion.com/solarwind2.html http://www.paradiseexcursion.com/solarwind3.html http://www.paradiseexcursion.com/solarwind4.html
Our Sun's Solar Flux Activity Our Earth's KP Activity Metrological and Similar Data
|
|---|
Solar Wind Speed Prediction/Forecasting Resources

The above images are what the solar wind looked like 24hrs before the entry into the 350 range. Links for the above are at: (be sure to select 24 hours)
http://www.swpc.noaa.gov/products/solar-wind-transit-time
http://www.swpc.noaa.gov/products/wsa-enlil-solar-wind-prediction
Additional Forecasting Resources:
Solar Wind Forecasting Speed up to 5 days in advance;
http://swe.uni-graz.at/solarwind/
Product: Forecast Discussion :Issued: 2015 Jan 16 1230 UTC # Prepared by the U.S. Dept. of Commerce, NOAA, Space Weather Prediction Center # Solar Activity
http://www.solarham.net/wwv.htm
8 Day Prediction of Solar Wind Speed utilizing the Wang-Sheeley-Arge model
http://legacy-www.swpc.noaa.gov/ws/predvel_7d.html
Beta testing text prediction model:
http://services.swpc.noaa.gov/experimental/text/dscovr-solar-wind-arrival.txt
Predicted solar wind speed (be sure to select 24 hours)
http://www.swpc.noaa.gov/products/predicted-solar-wind-earth
Solar Wind Speed
http://www.swpc.noaa.gov/products/wsa-enlil-solar-wind-prediction
Real TIme Solar Wind Speed Guages:
http://www.ez3dbiz.com/forecasting_tools.html
http://www.paradiseexcursion.com/solar_wind_panel.html
Because Coronal Holes are related to causing the solar wind speed to drop into the 350 range, more attention is going to be paid to these coronal holes. So when teh solar wind speed is approaching the favorable 350 range, more attention will be paid to the cornoal hole forecasts. In most cases coronal holes create high speed solar winds, but there are the "gold holes" which create the low speed 350 solar wind speed and these are the ones we are looking for.
Coronal Hole Forecasts:
http://www.ips.gov.au/Space_Weather/1/1
Coronal Hole History with Solar Wind Speed Data:
http://www.solen.info/solar/coronal_holes.html
This page gives an excellent report on Coronal Hole Forecasting:
http://meteowhitehorse.ca/wxsolen.php
Exact Solar Wind Speed:
http://www.spaceweatherlive.com/en/auroral-activity/aurora-forecast
ACE Solar Wind Speed – BE SURE TO SELECT 7 DAYS
http://www.swpc.noaa.gov/products/ace-real-time-solar-wind
Exact Solar Wind Speed:
Title: "Hourly Averaged Real-time Bulk Parameters of the Solar Wind Plasma"
ftp://ftp.swpc.noaa.gov/pub/lists/ace2/201401_ace_swepam_1h.txt
Main FTP Directory
ftp://ftp.swpc.noaa.gov/pub/lists/ace2/
A Stronger Dow Jones or for the Dow Jones to close higher on Wednesday January 14th, 2015 is forecasted
On Wednesday January 14th, 2015, the dow jones closed down over 180 points.
lessons learned from this forecast:
The Solar Wind had not yet approached 350 and the mini-cycle had ended. The solar wind speed is still at 400 and has not yet reached the 350 stage. .

This same pattern repeated itself, as shown in our In-Depth Research Page. A long term peaking solar flux carries with it the previous momentum from the dow the last few days. This same trend occurred on Jan 14th, 2015. So in future forecasts, if a microclimate weather change occurs within 4 days of a peaking solar flux, we can assume that the momentum from the previous dow will repeat itself during the microclimate swtich point date. The high speed solar winds (above 350, around 400) that occured on Jan 13th, 2015 should also have been a clue to a weaker dow.
The forecast for a stronger Dow Jones on Jan 14th, 2015 is based on the following solar weather conditions:
This is based on the following solar weather conditions. Air Pressure Rebound, Cosmic Rays Higher and DST higher. The key reason for the stronger dow jones on January 14th, 2014 is that X-Ray Background levels have been rising the previous few days due to increased S Optical flare activity. This pattern has now "Normalized" and the main shock is over. The 2nd key point is we are entering the solar wind speed of 350, which is a strong green period due to the increased optical levels, at which time a polarity switch will occur, leading to a stronger dow jones. BECAUSE THSI POLARITY SWITCH IS OCCURING CLOSE TO 350 AT THE END OF A CYCLE, THE DOW MAY ALSO CLOSE HIGHER ON JANUARY 16TH, 2015.
A Stronger Dow Jones or for the Dow Jones to close higher on Monday January 12th, 2015 is forecasted.
On Monday Jan 12th, 2014, the dow closed down 91 points.
Lessons Learned: DUE TO INCREASING X-RAY BACKGROUND LEVELS ALONG WITH SOLAR WIND SPEEDS AT HIGH LEVELS THE "SHOCK" HAD NOT PASSED LEADING TO A WEAKER DOW. The Jan 14th, 2015 forecast is for a stronger dow as normalization takes place.
The Forecast for the Dow to close higher or be stronger on Monday January 12th, 2015 is based on the following solar weather conditions.
Position #4 (green)
Solar Flux Peaks on Tues/Weds
Air Pressure Stronger (green)
Cosmic Rays Increasing (green)
CP Values Increasing (green)
DST Lower (red)
New moon approaching (faster slowdown in the solar wind speed)
Because the Solar Wind is approaching 350, it will override all the red periods. Also on Sunday, the solar wind speed entered the favorable range of 420.
View our New Page
A step by step guide of how I arrive at my dow forecasts
ParadiseExcusion.com forecasts a much weaker Dow or for the Dow Jones to closer Lower on Thursday January 8th, 2015.
On Jan 8th, 2015, the dow closed over 200 points higher and on Jan 9th, 2015, the dow jones closed down -170.50
Lessons Learned from the previous Dow Forecast on Jan 8th, 2015.
We are starting to see a trend to emerge. The majority of the most accurate forecast take place just after the most recent event in solar weather that is extreme or higher than average. Because extreme solar events cause the most profound changes, it would only make sense that the dow jones, would be affected also. To put it more simply, we can think of the Dow Jones as being an immune system for the industrialization.
The Dow Jones is the Immune System of the Industrialization of society. Our research at www.ez3dbiz.com, as proven that solar weather sensitive individuals are most affected by the first appearance of sudden changes in the sun's solar weather. The most profound affects take place at the very start and very end of higher solar activity. Also known as position #1 and Position #4. The solar wind has three healthy levels of wind speeds. They are 350, 420 and around 500. These are periods that create health in the body and are usually associated with position #4.
The dow jones behaves very similar and is solar weather sensitive and subject to the same "shocks" the immune system is. It is the extremes in Solar Weather that make dow forecasting extremely accurate.
A sudden jump in solar wind speeds, when it occurs at any solar wind speed, it does not have to be in the 350, 420 or 500 range and when there is a microclimate switch point occurring within a 48 hour period, it will create a weaker dow jones or the dow jones will close lower at the end of the day. This is magnified even more so if the S Optical levels are high or C Class flares are recently occurring. If high S. Optical or C Class solar flares are still present and the wind enters 350. 420 or around 500, these high solar extreme energy levels will cause the dow jones to be stronger or close higher at the end of the trading day.
The window of beneficial solar wind speeds occur at roughly intervals of between 70 to 80. So 350, 420 and 500 are the beneficial cross entry points. Now after the "shock" has passed from the solar wind jumping unexpectedly, (which is also known as a condition yellow) or if the solar wind enters 350, 420 or 500 and the microclimate switch point is occurring, the transition into the microclimate switch point signals a time of normalcy or when the balance returns after the shock is over. This occurs after 3 to 4 days of high speed solar winds or flat solar winds. This period of normality occurring is a readjustment and tolerance that has built up over a period of days after the sudden "shock" of the solar wind at high speeds.
The opposite is also true, after the solar wind speeds have been at low speeds or flat for a number of days the microclimate switch can cause a lower dow to restore balance. Forecasting is most accurate when the shocks occur because we can more easily predict the outcome due to stronger energies occurring.
So expect the most accurate forecasts when the solar wind has just "jumped" and during the entry into 350, 420 and 500 wind speeds.
As shown by the red circle in the image below, this is the period of "shock" (position #2 or #3) or most recent solar wind activity and the period where the dow will usually be weaker or close lower. When a microclimate switch point occurs within 48 hours of this jump in the solar wind forecasting accuracy is greatly increased.
The blue circle represents a time of normality, when the "Immune System" of the dow has recovered and forecasting is harder during this time because of the recovery and immunity built up from over the days.
However forecasting accuracy is increased again when the solar wind declines into the speeds of 420 and 350 and in some cases 500. (Position #4)

The forecast for the Dow to close lower on January 8th, 2015 is based on the following solar weather conditions:
Solar Wind Speed 500
Visual Solar Flux Line Flat (red)
Air Pressure rebounded (red)
KP levels extremely high (red)
Full Moon (red)
Mars 26 degrees (red)
Cosmic Rays Much Lower (red)
CP values dropping (red)
DST forecast lower (red)
X-Ray background flux levels steady and constant (green)
S Optical Levels Dropping (green)
ParadiseExcursion.com Write your own ticket to paradise by taking an excursion into the future dow jones. In the future after our conclusion of the beta testing of our mode, ParadiseExcursion.com will offer a free 30 day test drive to test our services. ParadiseExcursion.com guarantees at 95% or better dow forecast success rate or your money back. You have 30 days to test drive for yourself. Great for options traders who can purchase futures contracts and for those who trade stocks with the dow because you will know 24 hrs in advance the position of the dow jones at the end of the trading day.
As part of our increasing our forecasting accuracy, we ask that all viewers check back the morning before markets open to check this page for any sudden unexpected solar activity that may result in a change in the forecast. All results are usually posted the evening before markets open.
Cycles of the Sun's Solar Wind and the Cycles of the Dow Jones Industrial Average
The solar wind after being at high speeds for a while will usually have high levels of S. Optical numbers, X-ray Background Flux Levels and higher KP levels. It si during this period at the microclimate switch points that the dow becomes weaker, or will close lower, especially if there is a full moon present.
As the solar wind speed first enters the range of 420 or 350, at the microclimate switch point, the Dow Jones will be stronger or close higher.
And the higher the S. Optical, X-ray Background Flux levels and KP levels during the sun's solar wind speed entry into the 420 or 350 range, the Dow Jones will have more strength or close higher.
It is during the position #4 phase the S. Optical, KP and X-Ray Background Flux levels begin to go into decline or "cool down".
As the solar wind leaves the 350 range the dow jones will start to lose its strength or close lower.
I personally believe as a scientist researching solar activity for the past 8 years, that the sun's solar wind connects with other realities or possible universes and that the wind's expansion and contraction is somehow connected to other universes, creating a balance between these universes that exist side by side with us. At the microclimate switch point, these universes "split off" from each other. In one universe the dow jones closed higher and when the solar wind has jumped to high speeds, in that universe the dow jones has closed lower.
When you really think about it everything is connected to each other, including parallel universes and balance is a natural rhythm of nature. Perhaps solar wind activity is part of a energetic expression to keep this balance.
Why does the Dow Jones Forecast take Place every 5 or so days?
The information obtained to forecast the Dow Jones in advance comes through during high energy periods of solar activity. Much like a wormhole opens to send information through.
These higher periods of solar activity occur during what we at ParadiseExcursion.com term "mini-cycles", and in each mini-cycle there can be sub mini-cycles and so on, which rise and fall within the cycle.
These mini cycles occur on average once every 11 days or so.
To maintain our extremely high accuracy of dow forecasting, the information is only retrieved during these high energy periods. Think of it as a "pay check from the future". It is much better to be patient and wait for these wormholes to open and gain clear and accurate information, than to create a daily dow jones forecast with low accuracy. In this case, less is better.
As technology improves and solar instruments become more sensitive and data more easier to analyze, daily dow jones forecasting may one day become a reality, however at this date in time, our forecasting is much like early weather forecasting was when it began, easy to predict large storms, but hard to predict small variances in earth’s terrestrial weather. So we at ParadiseExcursion.com are going to continue to use the mini cycles to yield accurate results.
Some Questions about the Sun’s Solar Wind.
There are only 2 things that expand in our universe, the sun's atmosphere which is the solar wind and a black hole which is formed after the sun dies out and becomes a "red giant". Could the sun's solar wind be the energy from the future black hole?
Because there is balance in our universe, than there must be balance occurring in other universes around us. The art of rebalance takes energy, lots of energy. Could the sun’s solar wind be a connection to other parallel universes creating balance between universes that co-exist alongside us?
The Sun Drives Evolution
Our Sun is the driver of evolution and is constantly co-creating the future events that take place in our civilization. Our previous research over the years at ez3dbiz.com, has proven correct that at certain frequencies of the sun, terror attacks and other violent acts that affect people occur at these specific “window periods”, which are periods defined by the frequencies emitted by our Sun. You can view our research at the link below:
http://www.ez3dbiz.com/earth_behavior.html
Because we have built a model that can predict future major terrorist attacks, which are events that have an impact on policy and progress, it should make sense that the Dow Jones Industrial Average, which is really a simple performance summary of America’s top producing companies, which have an effect on the overall economy, which in turn affects civilization, that a model can be built to predict the future of the Dow Jones Industrial Average based on frequencies of the sun, which so far we have started to perfect.
This beta dow forecasting testing site is all about perfecting this model to accurately predict the Dow Jones Industrial Average. We use forecasting only when the sun's energy is at stronger levels. This is because the "time frequency" signal is clearer and easier to listen to than during times the sun is quiet. Simply put solar flares and solar activity broadcast a stronger signal than non-solar periods.
If you watch the movie “Frequency” you will have a better understanding of this energy flow and how its strength causes a clarity of the incoming signal. The movie shows how a solar flare is used to send and receive radio transmissions through space and time.
The Physics of Time Loops and Magnetic Reconnection
Energy loops itself to fulfill the energy cycle began at a point in time, An excellent way to test this for your self is whatever your energy was being put into a chosen task as the solar wind climbed above and passed the 350 mark, which happens most often during condition yellows, when the solar wind glides back down towards the 350 range again, the energy you originally put out at the rising solR wind into 350, is retuned to you and your ability to complete your goal or task becomes much smoother and much better with more energy behind you to fulfill that task, It is like momentum has built and is helping you succeed aLong the way, This could be why prayer is more effective at the 350 entry gateway speed. It could also explain why Intuition is boosted when the Milky Way sets on the western horizon. Tasks began at the Milky Way rising are given momentum and as the Milky Way sets in the west, you receive more momentum or intuitive energy to assist in further goal completion.
This than completes the cycle of energy or as it completes assists in goal creation.
So what you set I to motion as the solR wind is rising towards 350 will rerun to you as the wind descends agin towards 350. It is S if re descending period is where observation creates reality.
This loop confines over and over, driving evolution progress and creating never ending perfection and refinement.
Solar wind rise - Action towards goal
SolR wind decline - Allow yourself to become motivated towards your goal. A time to go with flow.
The Forecast for the Dow to Close higher on Tuesday January 6th, 2015 is based on the following solar weather conditions.
This forecast was revised late Monday Afternoon January 5th, 2015, as the solar wind speed unexpectedly jumped to high speeds. We posted on this page that the dow would close lower late money afternoon January 5th, 2015, of which it dropped -130.01 points on Tuesday January 6th, 2015
Horray! another accurate forecast. Thankfully our dow forecasting model is gaining 100% we hope this trend continues. As part of our increasing our forecasting accuracy, we ask that all viewers check back the morning before markets open to check this page for any sudden unexpected solar activity that may result in a change in the forecast. All results are usually posted the evening before markets open.
Microclimate Switch Point Date: Tuesday
NOAA FORECAST
2014 Dec 30 130 8 3
2014 Dec 31 125 11 3
2015 Jan 01 125 11 3
2015 Jan 02 120 13 4
2015 Jan 03 120 28 5
2015 Jan 04 120 17 4
2015 Jan 05 125 15 4
2015 Jan 06 140 9 3
The 4th is in a strong position #4. (green)
Long Term Solar Flux Position:
Heading Upwards towards a stronger solar flux (blue)
KP levels dropping to favorable levels after strong activity (green)
Solar Wind at 400 approaching 350 (green)
Solar wind out of turbulence phase (green)
Solar wind forecast for a long term decline into 350 (green)
Entering Optical Polarity Switch Phase
X-Ray Background Flux Stronger (green)
S. Optical and sunspot numbers have started increasing (blue)
Future KP levels are aggregative HOWEVER BECAUSE THE SUN’S SOLAR WIND IS ENTERING THE FIRST 350, THIS IS OVERRIDDEN (MAJOR GREEN)
Visual Solar Flux Line starting to increase (blue)
Air Pressure just rebounded (overridden by approaching green)
Full Moon (red)
CP Values increasing (Green)
DST higher
Cosmic Rays Increasing

Personal Observations After Making Correct Forecasts
I know when the forecast is correct because after reviewing in my mind following the logical steps to create the forecast, I next imagine that I have placed the dow forecast up on the website 24 hours before the markets begin. If the answer is correct, I will receive feedback via DeJaVu. If the answer is incorrect or the forecast is incorrect, than the DeJaVu feeling is not as strong. The key is to closely listen for the DeJaVu sensation just after having visualized posting the forecast.
When I run the DeJaVu exercise the feedback received sometimes tells me why I arrived at the correct answer, or the information received will be partly correct.
I have had the best results from doing this as the constellation Sagittarius sets over the western horizon. This is further amplified when the sun/moon is in the constellation Sagittarius. The sign Sagittarius also happens to be an intuitive sign.
The Many Worlds Theory of Balance and The Solar Wind
This is just a theory and observation. The solar wind gateway harmony speeds are times when perfect balance occurs between the forecast that drive the markets and innovation. When the solar wind is out of these gateway harmony speeds there is no balance occurring in this universe. This means that the energy may be bleeding back through to a parallel earth to bring balance to the dow jones in that parallel earth.
Does this mean that the parallel earth closest to us is composed of a higher density energy followed by other parallels earth’s of lesser energy / density?
This may also mean that the collective emotion that drives the markets is universal.
__________________
New Linking Upgrade
GET TEXT FROM PAGE FIRST BEFORE UPGRADING
Mini Cycle Calendar Forecasting:
Cycle Calendar courtesy of NOAA
http://www.swpc.noaa.gov/products/27-day-outlook-107-cm-radio-flux-and-geomagnetic-indices
___________________________________
Lockheed Solar Flux and KP Forecast
http://spawx.nwra.com/spawx/27do.html
_____________________
KP Activity and Forecasting
Aggregative:
http://www.paradiseexcursion.com/long_range_kp_map.html
Color coded
http://www.spaceweatherlive.com/en/auroral-activity/aurora-forecast
Real Time KP Levels
http://www.swpc.noaa.gov/products/planetary-k-index
Space Weather Associates
http://www.paradiseexcursion.com/long_range_kp_map.html
British Forecasting
http://www.geomag.bgs.ac.uk/data_service/space_weather/forecast.html
Wing KP Level
http://www.swpc.noaa.gov/products/wing-kp
USAF Forecast Flux and KP
http://www.swpc.noaa.gov/products/usaf-45-day-ap-and-f107cm-flux-forecast
27 day KP Forecast
http://www.swpc.noaa.gov/products/27-day-outlook-107-cm-radio-flux-and-geomagnetic-indices
Kp LEVELS LAST 30 DAYS
http://legacy-www.swpc.noaa.gov/ftpdir/indices/old_indices/2014Q4_DGD.txt
Future KP Aggregative Levels
http://origin-www.swpc.noaa.gov/products/report-and-forecast-solar-and-geophysical-activity
KP Levels 3 day forecast
http://www.swpc.noaa.gov/products/3-day-forecast
Current KP Levels Real Time
http://www.swpc.noaa.gov/products/planetary-k-index
__________________________________________________
_______________________________
Forecasting:
http://eng.sepc.ac.cn/SCF.php
KP Activity and Forecasting
USAF 15-minute Wing Kp Geomagnetic Activity Index #
ftp://ftp.swpc.noaa.gov/pub/lists/wingkp/wingkp_list.txt
Real Time 2mev
ftp://ftp.swpc.noaa.gov/pub/lists/particle/
_______________________________
2mev and Solar Flux Activity
Solar Flux Activity
http://www.swpc.noaa.gov/products/goes-x-ray-flux
2mev
2mev Forecast (Canadian Site):
http://www.spaceweather.ca/current-actuelle/fluence/sffl-eng.php
Optical Levels is accessible at the link below:
http://legacy-www.swpc.noaa.gov/ftpdir/indices/old_indices/
________________
CP Style Data
USAF Solar Flux and KP Forecasting
http://www.swpc.noaa.gov/products/usaf-45-day-ap-and-f107cm-flux-forecast
Magnemonitor; More Activity. Lower Dow
http://www.swpc.noaa.gov/products/goes-electron-flux
http://www.spacew.com/plots.html#
http://www.solarham.net/wwv.htm
http://mms.rice.edu/realtime/dials.html
http://www.spaceweatherlive.com/en/reports/forecast-discussion
View our New Page
A step by step guide of how I arrive at my dow forecasts
Solar energies and their effect on perception
At the microclimate switch date point in time, a stronger contrast of perception occurs from the resulting solar energies as they interact with earths geomagnetic field of energy.
This increased contrast affects overall perception.
If the microclimate switch date occurs on a Saturday, the perceptive energy travels back to Friday. Does this mean economic and industrial progress is the result of or fueled by perception?
If the microclimate switch point date occurs on a SUnday than the stronger contrasted energies roll over to Monday and the effects are about 30% to 40% less than if the microclimate switch point had occurred on a week day.
It is interesting to note that an analysis of the Dow covering 3 decades showed on average the Dow closed higher on Mondays than any other day of the week.
Please note to boost intuition when doing forecasts, a test is run through in the mind as having posted the forecast and an intuition scale of 1 through 10 is imagined with 10 being the highest (a more feeling of harmony if the forecast is correct) intutiive level or successfull forecast and 1 the lowest (more agitative feeling if the forecast is wrong). This is most accuracte when the constellation sagitarius sets over the western horizon, which is in the Milky Way. You can learn more about inuition and the Milky Way by visiting the links below:
The Link Below has the very best interpretation of what I have just explained above:
Recommended Reading: Intuition: Local Sidereal Time, Intuition and Sagittarius A
http://www.p-i-a.com/Magazine/Issue16/Intuition_16.htm
THE GALACTIC CENTER’S INFLUENCE ON PSI AND ESP
http://occultview.com/2011/01/09/the-galactic-center%E2%80%99s-influence-on-psi-and-esp/
Book: Enlightenment East and West
It takes approximately 9 hours for the Milky Way to set going from the tip of the Small Sagittarius Cloud to the end of the Large Sagittarius Cloud. I have had best results during the last 6 hours leading up to 13:30 LST time.
One very interesting discovery is that it is now a scientific fact that intuition is increased as Sagittarius sets over the western horizon. What I have also discovered is that as KP is within a certain range (between 5 and 7) and during the last 6 hours of 13:30 LST as the constellation Sagittarius sets over the western horizon, when I use intuition to check the future dow, my intuition is at a major peak. What is interesting in the correlation here is that KP levels have just peaked and are starting to decline or "set", much like the constellation Sagittarius has risen in the sky and than is setting, a window of intuition peaks during this window when these energies have peaked and are in decline. What is also interesting is intuition is also enhanced just before and after the full moon another period of peaking and than declining energetic energy.
Research of Correct Forecasts in Relation to KP levels:
Source courtesy of NOAA:
ftp://ftp.swpc.noaa.gov/pub/indices/old_indices/2015Q1_DGD.txt
Monday March 2nd, 2015 - forecast 100% accurate
KP Period:
2015 02 28 11 1 2 3 1 2 4 2 3 18 1 1 3 4 3 5 3 3 13 1 3 3 2 2 4 3 3
2015 03 01 23 5 4 5 4 3 2 2 2 36 4 5 5 7 2 1 2 2 28 5 5 5 4 2 2 2 3
2015 03 02 18 4 3 4 4 3 3 3 1 60 3 5 8 6 5 4 3 1 28 4 4 5 5 4 4 3 2
2015 03 03 10 3 3 2 2 2 2 1 3 21 1 2 3 6 5 1 1 2 11 3 3 2 2 2 1 2 3
On March 2nd, KP was in the 2nd day of decline
Monday February 23rd, 2015 - forecast 100% accurate
KP Activity
2015 02 21 8 3 3 1 1 2 2 2 2 6 2 2 2 3 1 1 0 1 7 3 3 1 1 2 1 1 2
2015 02 22 6 2 1 1 2 2 2 1 2 7 1 2 1 3 3 2 1 0 7 3 2 1 2 1 1 1 2
2015 02 23 14 3 2 2 3 3 4 2 3 25 2 1 4 5 5 5 3 2 17 3 3 3 3 3 4 3 4
2015 02 24 21 5 4 4 4 2 3 2 2 41 5 5 6 6 5 3 2 1 25 5 5 4 4 3 2 2 3
2015 02 25 7 2 1 3 2 3 2 1 0 20 0 0 3 6 5 2 2 0 9 1 1 3 2 3 2 1 1
KP peaked and declined 2 days later
February 18th, 2015 - forecast 100% accurate
KP activity
2015 02 16 4 0 1 0 1 2 1 2 2 3 0 0 2 2 1 0 1 1 5 0 1 1 1 1 1 2 3
2015 02 17 18 3 2 3 3 3 3 3 5 27 2 2 3 6 3 5 3 4 22 3 3 3 4 3 3 4 5
2015 02 18 15 5 3 3 3 2 2 2 2 28 4 4 5 5 5 3 2 1 19 5 4 3 3 2 2 2 3
2015 02 19 5 2 2 2 1 1 2 1 1 8 1 2 3 1 3 3 1 1 8 3 3 2 1 1 2 2 2
2015 02 20 4 0 2 2 1 2 1 1 1 7 1 0 2 3 4 1 0 1 6 1 2 2 2 2 1 1 2
KP Peaked and in decline
February 13th, 2015
KP activity
2015 02 11 5 2 3 0 0 2 2 1 1 8 1 1 0 2 5 1 0 0 7 2 3 1 1 2 1 0 1
2015 02 12 3 1 0 0 1 2 1 1 1 4 0 0 0 0 3 3 1 0 5 2 1 1 1 2 2 2 1
2015 02 13 2 0 0 0 1 2 1 1 1 2 0 0 0 3 1 0 0 0 3 0 0 0 1 1 1 1 1
2015 02 14 2 0 1 1 0 1 1 1 1 0 0 0 0 0 0 0 0 1 3 0 1 1 1 0 0 1 1
2015 02 15 5 0 2 2 1 3 1 1 1 11 1 0 2 3 5 3 1 0 6 1 2 2 2 3 1 1 1
KP peaked the day before and was in decline on the 13th
February 11th, 2015 - forecast 100% accurate
kp activity
2015 02 08 7 1 2 2 2 2 2 2 2 14 1 2 5 4 2 2 2 2 10 2 3 3 2 2 2 3 3
2015 02 09 5 2 0 1 0 2 2 2 2 7 2 0 0 1 4 3 1 1 8 3 1 1 1 3 2 2 3
2015 02 10 6 1 2 1 1 2 2 2 2 3 0 1 0 0 2 1 1 2 7 1 3 1 1 1 2 2 3
2015 02 11 5 2 3 0 0 2 2 1 1 8 1 1 0 2 5 1 0 0 7 2 3 1 1 2 1 0 1
2015 02 12 3 1 0 0 1 2 1 1 1 4 0 0 0 0 3 3 1 0 5 2 1 1 1 2 2 2 1
KP peaked the day before
Monday February 9th, 2015 - forecast 100% accurate
kp activity
2015 02 06 4 0 1 2 2 2 2 1 0 4 1 1 1 2 2 1 1 0 5 1 1 2 2 2 1 1 0
2015 02 07 9 1 0 3 4 2 2 1 2 23 0 0 3 6 5 4 2 1 9 1 0 3 3 2 3 2 2
2015 02 08 7 1 2 2 2 2 2 2 2 14 1 2 5 4 2 2 2 2 10 2 3 3 2 2 2 3 3
2015 02 09 5 2 0 1 0 2 2 2 2 7 2 0 0 1 4 3 1 1 8 3 1 1 1 3 2 2 3
2015 02 10 6 1 2 1 1 2 2 2 2 3 0 1 0 0 2 1 1 2 7 1 3 1 1 1 2 2 3
2015 02 11 5 2 3 0 0 2 2 1 1 8 1 1 0 2 5 1 0 0 7 2 3 1 1 2 1 0 1
2015 02 12 3 1 0 0 1 2 1 1 1 4 0 0 0 0 3 3 1 0 5 2 1 1 1 2 2 2 1
kp was in its 3rd day of decline
In summary, when KP levels are declining especially within 48 hours after a KP peak and in the range of between 5 and 7, intuition is enhanced as shown by the kp numbers above. This may move up in intervals of 7 or 8 arriving at 14, 21 and 28, much like the solar wind harmony gateway speeds move up in multiples of 80, so further research is necessary to confirm these "windows".
Now march 5th, 2015 the forecast was incorrect, however we have made proper modifications to the model so this does not happen again.
To add to formula:
A decline in KP + cycle #2 = Intuition is stronger
Date of Next Posting For Information Obtained from the
Wormhole Informational Access Data Point
This is a website in beta testing mode refining our dow forecasting model. As of Nov 15th, 2014, we are currently at test 7 of 30. We hope to acheive 100% Dow Forecasting on or before test #30.
Go to main page
The Next Cycle for Dow Forecasting is from December 26th, 2014 until January 10th, 2014. Please check back daily as solar weather forecasting is still in its infancy and the cycle may start early. The microclimate switch point date is Sunday December 28th, 2014. So the fist forcast for the position of the Dow Jones on Monday December 29th, 2014, will be posted on Sunday Dec 28th, 2014.
Cycle Calendar courtesy of NOAA
http://www.swpc.noaa.gov/products/27-day-outlook-107-cm-radio-flux-and-geomagnetic-indices
ParadiseExcursion.com Write your own ticket to paradise by taking an excursion into the future dow jones. In the future after our conclusion of the beta testing of our mode, ParadiseExcursion.com will offer a free day day test drive to test our services. ParadiseExcursion.com guarantees at 95% or better dow forecast success rate or your money back. You have 30 days to test drive for yourself. Great for options traders who can purchase futures contracts and for those who trade stocks with the dow because you will know 24 hrs in advance the position of the dow jones at the end of the trading day.
Cycles of the Sun's Solar Wind and the Cycles of the Dow Jones Industrial Average
The solar wind after being at high speeds for a while will usually have high levels of S. Optical numbers, X-ray Background Flux Levels and higher KP levels. It si during this period at the microclimate switch points that the dow becomes weaker, or will close lower, especially if there is a full moon present.
As the solar wind speed first enters the range of 420 or 350, at the microclimate switch point, the Dow Jones will be stronger or close higher.
And the higher the S. Optical, X-ray Background Flux levels and KP levels during the sun's solar wind speed entry into the 420 or 350 range, the Dow Jones will have more strength or close higher.
It is during the position #4 phase the S. Optical, KP and X-Ray Background Flux levels begin to go into decline or "cool down".
As the solar wind leaves the 350 range the dow jones will start to lose its strength or close lower.
I personally believe as a scientist researching solar activity for the past 8 years, that the sun's solar wind connects with other realities or possible universes and that the wind's expansion and contraction is somehow connected to other universes, creating a balance between these universes that exist side by side with us. At the microclimate switch point, these universes "split off" from each other. In one universe the dow jones closed higher and when the solar wind has jumped to high speeds, in that universe the dow jones has closed lower.
When you really think about it everything is connected to each other, including parallel universes and balance is a natural rhythm of nature. Perhaps solar wind activity is part of a energetic expression to keep this balance.
Why does the Dow Jones Forecast take Place every 5 or so days?
The information obtained to forecast the Dow Jones in advance comes through during high energy periods of solar activity. Much like a wormhole opens to send information through.
These higher periods of solar activity occur during what we at ParadiseExcursion.com term "mini-cycles", and in each mini-cycle there can be sub mini-cycles and so on, which rise and fall within the cycle.
These mini cycles occur on average once every 11 days or so.
To maintain our extremely high accuracy of dow forecasting, the information is only retrieved during these high energy periods. Think of it as a "pay check from the future". It is much better to be patient and wait for these wormholes to open and gain clear and accurate information, than to create a daily dow jones forecast with low accuracy. In this case, less is better.
As technology improves and solar instruments become more sensitive and data more easier to analyze, daily dow jones forecasting may one day become a reality, however at this date in time, our forecasting is much like early weather forecasting was when it began, easy to predict large storms, but hard to predict small variances in earth’s terrestrial weather. So we at ParadiseExcursion.com are going to continue to use the mini cycles to yield accurate results.
The Forecast for the Dow to Close higher on Tuesday January 6th, 2015 is based on the following solar weather conditions.
This forecast was revised late Monday Afternoon January 5th, 2015, to the dow opening lower, as the solar wind speed unexpectedly jumped to high speeds, which caused the dow jones to close -130.01 on Tuesday January 6th, 2015
Microclimate Switch Point Date: Tuesday
NOAA FORECAST
2014 Dec 30 130 8 3
2014 Dec 31 125 11 3
2015 Jan 01 125 11 3
2015 Jan 02 120 13 4
2015 Jan 03 120 28 5
2015 Jan 04 120 17 4
2015 Jan 05 125 15 4
2015 Jan 06 140 9 3
The 4th is in a strong position #4. (green)
Long Term Solar Flux Position:
Heading Upwards towards a stronger solar flux (blue)
KP levels dropping to favorable levels after strong activity (green)
Solar Wind at 400 approaching 350 (green)
Solar wind out of turbulence phase (green)
Solar wind forecast for a long term decline into 350 (green)
Entering Optical Polarity Switch Phase
X-Ray Background Flux Stronger (green)
S. Optical and sunspot numbers have started increasing (blue)
Future KP levels are aggregative HOWEVER BECAUSE THE SUN’S SOLAR WIND IS ENTERING THE FIRST 350, THIS IS OVERRIDDEN (MAJOR GREEN)
Visual Solar Flux Line starting to increase (blue)
Air Pressure just rebounded (overridden by approaching green)
Full Moon (red)
CP Values increasing (Green)
DST higher
Cosmic Rays Increasing
The forecast was for the Dow Jones to close slightly higher on Monday Dec 29th, 2014.
On Monday December 29th, 2014, the Dow Jones closed lower at -15.48 (0.09%)
Lessons Learned: Solar Wind Speed Jumped to 680 late on the 28th of Dec, 2014. This missed the 350 entry point, causing the dow to close lower. If the solar wind had not jumped, the dow would have closed higher as forecasted. When this happens, it is called a "condition yellow". In the future, we may check solar wind conditions 3 hrs before the markets open to be sure that the solar wind has not "jumped" and than re-evaluate the forecast as necessary.
Spotting Potential Condition Yellows
If turbulence in the solar wind is forecast, and the solar wind has been hovering around 370, or just out of the green range, than it means that a condition yellow may be coming at the next microclimate switch point, especially a condition yellow has not occurred during the previous 4 to 11 days.
Clues that this jump in the sun’s solar wind is going to occur are to check if air pressure has rebounded and if DST is lower. Ignore cosmic rays and other metrological data during this condition.
When an increase in the solar wind is forecast a condition yellow may occur at a predicted 350 wind period. You can tell that a condition yellow is about to occur for 3 reasons:
It has not occurred during the previous 11 days
The solar wind speed will “hover” just above the 350 entry point and not drop to 350.
There will be forecasted turbulence and the line will not be smooth.
If the solar wind is forecast to “jump” and hovering above 350 for a number of days, because the microclimate switch date is a date where conditions change the condition yellow will likely manifest on that microclimate swtich date.
This may be of value because a stronger dow may manifest a few days before because the solar wind is starting to enter 350. This occurred during the week of Dec 26th, when the dow was stronger and than on the 29th, of Dec, it was slightly weaker as the condition yellow manifested.
As we can see in the image below shown by the blue circle, the forecast for the Solar wind was for more “turbulence”, which resulted in the condition yellow. Now, the green circle shows less turbulence, meaning that around this date, the solar wind speed should enter 350 without any hindrances, making forecasting more accurate.
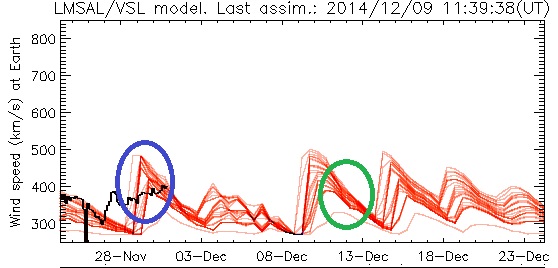
This dow jones forecast for it to close slightly higher on Monday December 29th, 2014. is based on the following Solar Weather Conditions
Approaching Position #4, from position 3 in cycle. (green)
Microclimate switch point occurred on Sunday, at the peak of a long term solar flux peak, meaning that Monday the dow results from Friday will manifest. (green)
Optical Decreasing (green)
X-Ray Background Levels approaching into the favorable 4.0 range (Green)
Falling into a more favorable KP range (green)
http://www.swpc.noaa.gov/products/report-and-forecast-solar-and-geophysical-activity
2mev levels higher and forecast higher slightly (green)
Visual Red line of solar flux starting new activity (blue/green)
Solar Wind Speed approaching 350, after a 3 or more day slow decline from high winds (green)
Air Pressure has already rebounded (red)
Cosmic Rays Increasing (green)
CP Values Higher (green)
DST lower (red)
Solar Wind Forecast Higher (red)
Pre-Dow Forecast:
The preliminary forecast is for the dow to close higher or be stronger on Monday the 29th of December. The final forecast will be posted on Sunday Dec 28th, 2014. The forecast is based on the solar weather conditions:
Possible Approaching Position #4 on the 29th
The 29th is a long term solar flux peak period. This means momentive force from the previous dow may carry through to Monday.
Microclimate Switch point date is on Sunday Dec 28th
Stronger dow previous 3 days
Solar wind speed is forecast to enter 350 on Monday
Current solar wind speed as of 12-26 is 480
KP levels forecast higher
Our Sun is the driver of evolution and is constantly co-creating the future events that take place in our civilization. Our previous research over the years at ez3dbiz.com, has proven correct that at certain frequencies of the sun, terror attacks and other violent acts that affect people occur at these specific “window periods”, which are periods defined by the frequencies emitted by our Sun. You can view our research at the link below:
http://www.ez3dbiz.com/earth_behavior.html
Because we have built a model that can predict future major terrorist attacks, which are events that have an impact on policy and progress, it should make sense that the Dow Jones Industrial Average, which is really a simple performance summary of America’s top producing companies, which have an effect on the overall economy, which in turn affects civilization, that a model can be built to predict the future of the Dow Jones Industrial Average based on frequencies of the sun, which so far we have started to perfect.
This beta dow forecasting testing site is all about perfecting this model to accurately predict the Dow Jones Industrial Average. We use forecasting only when the sun's energy is at stronger levels. This is because the "time frequency" signal is clearer and easier to listen to than during times the sun is quiet. Simply put solar flares and solar activity broadcast a stronger signal than non-solar periods.
If you watch the movie “Frequency” you will have a better understanding of this energy flow and how its strength causes a clarity of the incoming signal. The movie shows how a solar flare is used to send and receive radio transmissions through space and time.
There are only 2 things that expand in our universe, the sun's atmosphere which is the solar wind and a black hole which is formed after the sun dies out and becomes a "red giant". Could the sun's solar wind be the energy from the future black hole?
Scientific Reserach Regarding the Sun's Solar wind and the Markets
Do Our Sun and Stock Market Share a Rhythm. Article by NASA
Astrophysicists at the University of Warwick have applied data analysis methods used to model stock market fluctuations, to explore changes in the solar wind (the sun's expanding atmosphere). They have discovered that the fluctuations in the solar wind follow the same kinds of patterns seen in the stock markets -- particularly when it comes to the number of extreme events or large fluctuations.
http://solarsystem.nasa.gov/news/display.cfm?News_ID=3174
The Solar Winds Effect on the U.S. Stock Market. Research Article by Time-Price-Research.
http://time-price-research-astrofin.blogspot.com/p/solar-activity-markets.html
Geomagnetic storms and stock market returns. Research article by Astro Trading.
http://www.astro-trading.net/2011/01/geomagnetic-storms-and-stock-market.html
Stock Market Swings Help Researchers Understand Extreme Events In Solar Wind
http://www.sciencedaily.com/releases/2002/07/020726081058.htm
Current Successfull Model (as refined during the previous 3 months). Published December 20th, 2014.
Position Checklist
Position #1 - Increasing Solar Activity (stronger dow)
Position #2 - Solar Activity Constant (weaker dow)
Position #3 - Solar Actiivty Peak (weaker dow)
Position #4 - Solar Activity in Decline (stronger dow)
__________________________________________________
Solar Weather Position Indicators to watch for to Gauge the
Future Dow Jones Position
Position Scale:


Cycle Calendar 27-Day Outlook of 10.7 cm Radio Flux and Geomagnetic Indices courtesy of NOAA)
http://origin-www.swpc.noaa.gov/products/27-day-outlook-107-cm-radio-flux-and-geomagnetic-indices
Positions 1 and 2 (condition blue into red)- As position #1 approaches, look for the microclimate weather change ahead.
Next to find the increase in solar activity, look for higher or lower cosmic rays and higher 2 mev s forecast. These will occur within 24 hours of each other (with the possible exception of the cosmic rays). You can then use this to know when the rise/increase in solar flux will occur. A first increase in solar flux boosts the dow.
Positions #1 are extremely hard to predict because current solar weather forecasting is new. However, when position #1 has begun (which is the beginning of the mini cycle or similar), the forecasting of Position #4 is extremely easy, hence the high success rate achieved with forecasting during position #4.
Other favorable indicators for a stronger dow include: solar wind speeds (350 or approaching 420. 420 is valid only after high solar wind speeds) KP levels. If any of these are out of tune, than the dow will close lower or be weaker for the day.
Position 3 (red into green)- This is a period of built up pressure about to be released. More attention is paid to these particular solar positions; Metrological Data such as CP values, Increasing Cosmic Rays, Rebound in air pressure, Optical declining, declining solar flux (watching visually the red line), reduction in X-Ray background levels, CP Values and DST positions and similar metrological data.
Position 4 (green) - During position #4, if the solar wind speed is entering the speed of 350 for 3 or more days, the date closest to the microclimate switch point will be based on the solar wind speed. In some cases a 2nd favorable solar wind speed between 420 and 450 will occur, which is more common during the summer months when the sun's activity is higher.
Accuracy Windows (Position #4), ending of the mini cycle.
Many of our most accurate forecasts are made towards the end of a solar mini-cycle. This is a period where the sun’s solar wind is less likely to suddenly jump (condition yellow) and the dow is stronger or more likely to close higher at the end of the trading day.
It is during this ending of the mini-cycle (position #4) and the solar wind starts “cooling down” by entering the solar wind speeds of 500, 420 or 350 dow forecasting accuracy is maximized. The green square in the image below shows the strongest accuracy zone.

To Look for Position #4
Position #4 is the period just after higher / stronger geomagnetic activity and where earth's geomagnetic energy goes into decline to favorable levels.
As the solar wind enters the wind speed of 350, the Optical may increase, which will create a stronger condition green or higher dow jones. This increase in optical can be accompanied by stronger or rising x-ray background radiation levels.
Once the solar wind speed approaches 350, future aggregative KP forecasts and stronger x-ray background levels are overridden by the solar wind (or the polarity changes). This feature is only is prominent at the end of the cycle (position #4).
This feature occurs exactly as the solar wind enters the favorable solar wind speed.
Clues to look for
The 2mev s will be stronger within 24hrs of the microclimate weather change date when the solar wind enters this favorable range.
In some cases the solar wind speed will be at high levels (the second favorable period of 420) and just going into its "burn down" phase into the favorable range. If the cosmic rays, CP values, higher 2mev and DST values are higher, the dow will close lower, but show strength throughout the day.
The Long Term 350 Solar Wind
Most common after higher periods of longer solar activity. As the solar wind speed approaches the long term 350 range (meaning it will be at this speed for a few days), the built up pressure will be released and the CP, cosmic rays and similar metrological data will reverse their polarity (much like KP values) and the solar wind will take precedent over these, allowing for the dow jones to close higher at the end of the trading day.
The S Optical levels can work both ways, they can increase the energy of a higher dow or if the Solar Wind Speeds are above 480, they will increase the energy of a lower dow. IT IS THE SOLAR WIND SPEEDS OF 350 OR 420 THAT CAUSES THE CHANGE IN THIS POLARITY

The red line that is slanting after the peak, as it enters the 350 wind speed = condition green.
When an increase in the solar wind is forecast a condition yellow may occur at a predicted 350 wind period. You can tell that a condition yellow is about to occur for 3 reasons:
It has not occurred during the previous 11 days
The solar wind speed will “hover” just above the 350 entry point and not drop to 350.
There will be forecasted turbulence and the line will not be smooth.
If the solar wind is forecast to “jump” and hovering above 350 for a number of days, because the microclimate switch date is a date where conditions change the condition yellow will likely manifest on that microclimate swtich date.
This may be of value because a stronger dow may manifest a few days before because the solar wind is starting to enter 350. This occurred during the week of Dec 26th, when the dow was stronger and than on the 29th, of Dec, it was slightly weaker as the condition yellow manifested.
As we can see in the image below shown by the blue circle, the forecast for the Solar wind was for more “turbulence”, which resulted in the condition yellow. Now, the green circle shows less turbulence, meaning that around this date, the solar wind speed should enter 350 without any hindrances, making forecasting more accurate.
Final Forecast Checklist:
Long Term Solar Flux Position:
Is the Sun's Solar Flux Peaking and about to go into decline?
Yes
No

At the peak of the microclimate switch point it sets the trend for the coming 48 hours. The Microclimate Switch Point can occur within 48 hours of the peak of the sun’s solar flux. This means if the dow closes lower at the switch point, it will close lower in the coming days.
When the solar flux has peaked and is going into a long term decline, in some cases it will take with it the previous momentum of the dow 24 to 72 hours before, especially if the solar wind speed is about to enter a long period of 350 in the coming days ahead .
Peaking Solar Flux levels will push previous momentum of the dow further, especially if the solar wind speeds are above 420.
It is key to watch the position of the Dow the previous 24 to 72 hours during this phase. If the dow is lower, than depending on conditions, it may be lower the next 24 hours ahead. If higher the previous 24 to 72 hours, this momentum may carry on through to the microclimate switch point date.
If there is a forecast for a longer 350 wind entry, than as the solar wind comes down from high speeds, entering 420, the dow may be stronger for the day, yet close lower.
The red circle below shows the solar flux going into decline after days of increasing.

Link for above:
http://spawx.nwra.com/spawx/27do.html
The circle we believe is the main clue to watch for in future forecasts.
So in some cases, the future position of the dow can be forecast up to 24 within the period of a microclimate switch, and this peak in solar flux activity, creates momentive energy from the dow the previous 24 hours. This will manifest the following day and if we are headed towards a position #4, the CP values can show that the next 24 hrs ahead the dow will close higher.
As a peak in the long term solar flux creates momentum, than a low or where the solar flux is about to increase over the long term, usually causes a stronger dow.
This technique is currently undergoing refinement
The long term solar flux peak must be checked as recent as possible as the data sometimes changes daily.
Position #2. High Speed Solar Wind Speeds – At the KP peak, closest to this solar flux peak will show future dow based on the dow position / strength the previous 72 hours before.
If the solar flux peaks with the microclimate and KP the forecast should be done 24 hours before the microclimate switch date because the momentive energy will carry through the microclimate switch point date.
Day 1--------------dow research done on this date, based on where the dow has been the previous 72 hours
Day 2 .--------------- date of actual forecast
Day 3 ---------------- Solar flux peaks on this date as well as Microclimate Switch Point Day. Solar weather conditions on this date determine the dow on Day #2 and should match a stronger or weaker dow that occurred 72 hours previous starting at Day 1
The changing Polarity of the revolving Solar Wind
There is an energy that pervades the solar wind which governs life and circumstances on earth. This energy contains within it 2 polarities, which change their polarity at certain wind speeds of the solar wind. This energy is composed of magnetic particles which when become concentrated in high enough density form their own polarity, much like the north and south pole of a magnet. It is a fact that Earth's magnetic field has flipped its polarity many times over since its inception. If you happened to be facing north on Earth approximately 800,000 years ago with a magnetic compass in your hand, your compass needle would be pointing 'south,' as if your compass was broken. But in fact it is because the polarity of Earth’s north and south pole had changed.


At higher S Optical with high solar wind speeds = Red (weaker dow)
At higher S Optical with solar wind speeds entering 420 or 350 = Green (stronger dow)
S Optical means solar flare intensity or number of solar flares. The higher the optical, the stronger the Red or Green (or weaker or stronger dow). You can locate S optical at the link below:
http://legacy-www.swpc.noaa.gov/ftpdir/indices/old_indices/
In some cases, the long term 10.7 solar flux peak can show an indication of the intensity or how strong the future Optical will be.
The Long Term Solar Flux Forecast can be accessed below:
http://spawx.nwra.com/spawx/27do.html
Is the Solar Wind About to Enter a Long Term 350 Range?
A clue to watch for a perfect strong long 350 wind entry is to look for the smooth line of the solar wind forecast. It will be long and smooth, signifying that the solar wind speed is about to enter 350.
ONE VERY IMPORTANT KEY IS THAT IF THE LINE IS LONGER AND THE SOLAR WIND IS ENTERING 420, THAN THIS MEANS THAT THE UPCOMING FORECASTED 350 ENTRY POINT WILL BE STRONGER OR OVERRIDE THE 2ND CONDITION GREEN 420 SPEED. SO IT IS KEY TO BE PATIENT AND WAIT FOR THE 350 ENTRY POINT FOR BEST ACCURACTE RESULTS.

Link for the above image
http://www.lmsal.com/forecast/wind.html
Another clue is to watch for an increase in the KP levels. If the KP forecast is for an increase in KP levels, even if aggregative, this is the day that the energy of the 350 wind will manifest.
Turbulance
In some cases after a long period of higher solar activity, there may be some "turbulence" occurring. This turbulence occurs in the form of KP spikes, right before the 350 wind speed. At the 350 entry point, there will usually be a rise in KP levels, indicating the entry point date.
Is there a spike in the solar wind (a condition yellow?)
The image below shows a spike of turbulance in the solar wind as it starts to cool off or enter into the 350 wind speed. This spike was unexpected and occured 12 hrs after we posted the forecast. Accompanying this spike was a short burst of KP activity.

An example of the solar wind spike is to observe the forecast made on Tues Dec 16th, 2014. This caused a stronger dow for the day, yet the dow closed lower within the last 2 hours of the day. We are aiming for a higher dow at the end of the day overall. We believe we have solved this problem by looking for short term turbulence occurring in the KP or geomagnetic activity. This can be forecast by looking at the KP levels for the next 3 days ahead, and if 2 or more days of sudden turbulent kp activity lay ahead, this is a clue that the solar wind may spike..(KP IS ALSO CALLED THE AP INDEX)
Future KP levels
http://www.paradiseexcursion.com/kp_forecasting.html
Because these spikes in the solar wind occur on average every 11 days, once one has occured it should not occur again for the next 10 or so days as a microclimate occurs. During the summer season (june to august, in the Northern Hemisphere) it can occur more often as the sun is more active.
Link for above
http://www.swpc.noaa.gov/products/ace-real-time-solar-wind
To go into more detail about this unexpected spikes, as we can see in the image below, the solar wind spiked during the 16th, causing a short term spike in the solar wind speeds (shown by the red circle). This is commonly associated with a condition yellow period, which leads to an overall lower dow jones. On December 17th, the solar wind speed was smooth and gradually headed towards 350, with no spike. On December 17th, 2015, the Dow Jones closed Up over 200 points (shown by the purple circle).This was the energy of the position #4 manifesting.
Is the Pressure Built up and About to Release Itself?
The Release of Pressure
The buildup of pressure occurs most often during the position #3 period and its release occurs during the position #4 period.
As the solar wind winds down from days of being at high speeds, it enters 2 favorable phases. First the solar wind speed of 420 and than again at 350.
As it enters these wind speed ranges, a release of pressure that has been building during the high speed solar wind speeds during the previous few days is released , which leads to a position #4.
When there is a long term decline into the favorable wind speed of 350, it will override the strength of the dow at the 420 wind range. Making forecasting for the 350 range much more accurate and preferred.
During new moons, the solar wind speed declines faster and during full moons slower.
Stronger or sustained 2mev levels will verify that the energy of the condition green will be stronger.
By checking the CP, Cosmic Ray and DST values, when these are at higher levels, we know that the pressure is about to be released and are about to enter a position #4.
Forecasted upcoming higher KP will be an indicator of the next date of an increase in the dow jones, even if the KP forecast is for aggregative levels, because the solar wind at 350 this position overrides aggregative KP levels. Aggregative levels mean KP levels that are higher than usual and usually contribute to health issues.
Upcoming higher KP will be an indicator of the next date of an increase in the dow jones, even if the KP forecast is for aggregative levels, because the solar wind at this position overrides aggregative KP levels.
Possible Refined New Forecasting Model based using the solar wind (posed 12 – 26 – 14)
Because the solar wind speed at certain points overrides metrological data and is the primary mover of the energy that drives market changes we can use these stronger points as main forecasting parameters.
Position #1 – Solar wind speed below 350.
Position #2 – The solar wind just starts entering 350 or 420 and is growing in speed along with an increased solar flux
Position #3 – The peak of the solar flux, solar wind speeds are above 480 and the pressure wave is building.
Position #4 – The pressure wave bursts, solar wind speed is entering 420 or 350. If optical is higher at this entry point the green will be stronger, indicating a much higher dow.
The swings of the dow are always strongest right at the start of these solar wind speed entry points
Additional Notes:
As the solar wind winds down from days of being at high speeds, it enters the speeds of 420 or 350. As it enters this wind speed range, a release of pressure that has been building during the high speed solar wind speeds is released , which leads to a position #4.
During new moons, the solar wind speed declines faster and during full moons slower.
By checking the CP, Cosmic Ray and DST values, when these are at higher levels, we know that the pressure is about to be released.
Please scroll further down this page for additional details on what Green, Red and Blue means and other interpretations. This is a beta site and when test run #30 has been completed, will be formatted into a more Coherent and organized format.
Position Checklist
Position #1 - Increasing Solar Activity (stronger dow)
Position #2 - Solar Activity Constant (weaker dow)
Position #3 - Solar Actiivty Peak (weaker dow)
Position #4 - Solar Activity in Decline (stronger dow)
Positions 1 and 2 - More attention is paid to these particular solar positions; Stronger 2mev's (blue), solar wind speeds (350 or approaching 420. 420 is valid only after high solar wind speeds) KP levels. If any of these are out of tune, than the dow will close lower or be weaker for the day.
As position #1 approaches, look for the microclimate weather change ahead, higher or lower cosmic rays and higher or lower 2 mev s. These will all occur within 24 hours of each other (with the possible exception of the cosmic rays). You can then use this to know when the rise/increase in solar flux will occur.
Position 3 - These are indicators that the pressure is about to be released. More attention is paid to these particular solar positions; Metrological Data. Increasing Cosmic Rays, Rebound in air pressure, Optical declining, declining solar flux (watching visually the red line), reduction in X-Ray background levels, CP Values and DST positions.
Position 4 - During position 4, if the solar wind speed is entering the speed of 350 for 3 or more days, the date closest to the microclimate switch point will be based on the solar wind speed. This trend of the solar wind speed overriding future aggregative KP forecasts and x-ray background levels is only is prominent at the end of the cycle (position #4). It is like a final climax of the cycle.
Another interesting feature is to confirm a stronger dow at position #4, is the 2mev s will be stronger within 24hrs of the microclimate weather change date.
Another interesting highlight about Position #4, is that at the end of the cycle as the KP and solar flux peak along with the solar wind entering 350, stronger or rising x-ray background radiation levels will increase the benefical influence of the solar wind.
Long Term Solar Flux Position:
The red line that is slanting after the peak, as it enters the 350 wind speed = condition green.
Is the Sun's Solar Flux Peaking? When the solar flux has peaked and is going into a long term decline, it will take with it the previous momentum of the dow 24 to 72 hours previously . If approaching solar flux peak, watch the position of the Dow the previous 24 to 72 hours. If the dow is lower, than depending on conditions, it may be lower the next 24 hours ahead. If higher the previous 24 to 72 hours, this momentum may carry on through to the microclimate switch point date.
Link for above:
http://spawx.nwra.com/spawx/27do.html
Is there a spike in the solar wind (a condition yellow?)
Because these spikes occur on average every 11 days, once one has occured it should not occur again for the next 24 hrs ahead as a microclimate occurs.
Link for above
http://www.swpc.noaa.gov/products/ace-real-time-solar-wind
If cosmic rays, CP values, higher 2mev and DST values are higher, the dow will close lower, but show strength throughout the day.
The Release of Pressure
As the solar wind winds down from days of being at high speeds, it enters the speeds of 420 or 350. As it enters this wind speed range, a release of pressure that has been building during the high speed solar wind speeds is released , which leads to a position #4.
During new moons, the solar wind speed declines faster and during full moons slower.
By checking the CP, Cosmic Ray and DST values, when these are at higher levels, we know that the pressure is about to be released.
Upcoming higher KP will be an indicator of the next date of an increase in the dow jones, even if the KP forecast is for aggrevative levels, because the solar wind at this position overrides aggregavtive KP levels.
The S Optical levels can work both ways, they can increase the energy of a higher dow or if the Solar Wind Speeds are above 480, they will increase the enregy of a lower dow. IT IS THE SOLAR WIND SPEEDS OF 350 OR 420 THAT CAUSES THE CHANGE IN THIS POLARITY
The Sudden Spike or Unexpected Condition Yellow
The sudden "spike" that occurred for the Dow Jones Forecast on Tues Dec 16th, 2014, we believe we have solved this problem by looking for short term turbulence occurring in the KP or geomagnetic activity. This can be forecast by looking at the KP levels for the next 3 days ahead, and if 2 or more days of sudden turburlent kp activity lay ahead, thi sis a clue that the solar wind may spike..(KP IS ALSO CALLED THE AP INDEX)
Future KP levels
http://www.paradiseexcursion.com/kp_forecasting.html
___________________________________
Knowing when the 350 solar wind will be stronger and its entry point.
A clue to watch for a perfect strong 350 wind entry is to look for the smooth line of the solar wind forecast. It will be long and smooth, signifying that the solar wind speed is about to enter 350.
ONE VERY IMPORTANT KEY IS THAT IF THE LINE IS LONGER AND THE SOLAR WIND IS ENTERING 420, THAN THIS MEANS THAT THE 350 ENTRY POINT WILL BE STRONGER OR OVERRIDE THE 2ND CONDITION GREEN 420 SPEED. SO IT IS KEY TO BE PATIENT AND WAIT FOR THE 350 ENTRY POINT FOR BEST ACCURACTE RESULTS.
Link for the above image
http://www.lmsal.com/forecast/wind.html
Stronger or sustained 2mev levels will verify that the energy of the condition green will be stronger.
KP levels
http://www.n3kl.com/sun/images/noaa_kp_3d.gif?
Solar Flux
http://services.swpc.noaa.gov/images/goes-xray-flux.gif?
Solar Wind
http://services.swpc.noaa.gov/images/ace-mag-swepam-3-day.gif?
Solar Weather Database
http://www.lmsal.com/solarsites/

As we fail at some of our forecasts, we get better and better and refining the model and spotting where we went wrong. Also our overall forecasting is getting more and more accurate, especially at position #4.
The lessons in this forecast were relatively simple.
1: We have also noticed that when the solar flux has peaked and is going into a long term decline, it will take with it the previous momentum of the dow 24 to 72 hours previously . The dow had closed lower on the 14th and 15th, which carried through onto the 16th of Dec 2014. We believe this is the main clue to watch for in future forecasts.
Link for above:
http://spawx.nwra.com/spawx/27do.html
2: We were at the very end of a position #3, which is a period where the Dow Jones is usually weaker (see chart below for position info). A position #4 is the period just after higher geomagnetic activity and where earth's geomagnetic energy starts to decline. This decline occured on the 16th, however the energy of the solar wind seems to have pushed it through onto Thursday, Dec 17th, after the spike in the solar solar wind faded. .
3: The solar wind spiked during the 16th, causing a short term spike in the solar wind speeds (shown by the red circle). This is commonly associated with a condition yellow period, which leads to an overall lower dow jones. Now on December 17th, the solar wind speed was smooth and gradually headed towards 350, with no spike. On December 17th, 2015, the Dow Jones closed Up over 200 points (shown by the purple circle).This was the energy of the position #4 manifesting.
Because these spikes occur on average every 11 days, once one has occured it should not occur again for the next 24 hrs ahead as a microclimate occurs.
Our previous research over the years has shown that when the solar wind line speed gradually declines without any spikes into the 350 or 420 range that the dow jones will be stronger. Other minor indicators were increased X-ray bacakground levels above 4.0.Because these aspects were stronger, it explains why the dow jones overall was higher throughout the day, than rapidly going into decline during the final part of the day.
Link for above
http://www.swpc.noaa.gov/products/ace-real-time-solar-wind
4: Because as we can see from the image of the Dow Jones activity, overall, the dow jones was stronger throughout the day and than declined rapidly during the last few hours. This was beacuse the cosmic rays, CP values, higher 2mev and DST values were all at high levels (see these links below). Overall the solar wind is the final contributor and its position will indicate where the dow jones will be at the end of the day.
For those of you on the journey of perfecting the dow, thank you for your continued dedication, as in the end continued research and observation will continue to refine and perfect the model.
So in conclusion, the future position of the dow can be forecast up to 24 hours after a microclimate swtich, and when there is a peak in solar flux activity, momentive energy from the dow the previous 24 hours will manifest the following day and if we are headed towards a position #4, the CP values can show that the next 24 hrs ahead the dow will close higher.

Cycle Calendar 27-Day Outlook of 10.7 cm Radio Flux and Geomagnetic Indices courtesy of NOAA)
http://origin-www.swpc.noaa.gov/products/27-day-outlook-107-cm-radio-flux-and-geomagnetic-indices

The Dec 11th, 2014, dow forecast is based on the following solar weather conditions
Approaching a first stage position #2 in this sycle (red)
Solar Wind Speed is in Decline (green)
Solar Wind Speed Approaching 400 currently at 420 (green)
Solar Wind Speed is forecasted Lower (green)
KP is in decline from previous high levels (green)
KP levels on the 11th are forecasted lower
Visual Red line of Solar Flux has increased (blue)
Long Term Solar Flux levels are increasing (blue)
Aggregative KP levels are forecasted as low aggrevative levels (green)
X-Ray background Flux Levels are stronger (red)
14 S Class Optical Flares (red)
2mev protons forecated to be lower on the 11th (red)
Dow Jones Dropped 300 points on Wednesday Dec 10th, 2014 (red)
DST lower (red)
Air Pressure starting to rebound (green)
Cosmic Rays rising (green)
CP values dropping (red)
Our Sun is the driver of evolution and is constantly co-creating the future events that take place in our civilization. Our previous research over the years at ez3dbiz.com, has proven correct that at certain frequencies of the sun, terror attacks and other violent acts that affect people occur at these specific “window periods”, which are periods defined by the frequencies emitted by our Sun. You can view our research at the link below:
http://www.ez3dbiz.com/earth_behavior.html
Because we have built a model that can predict future major terrorist attacks, which are events that have an impact on policy and progress, it should make sense that the Dow Jones Industrial Average, which is really a simple performance summary of America’s top producing companies, which have an effect on the overall economy, which in turn affects civilization, that a model can be built to predict the future of the Dow Jones Industrial Average based on frequencies of the sun, which so far we have started to perfect.
This webpage is all about perfecting this model to accurately predict the Dow Jones Industrial Average. We use forecasting only when the sun's energy is at stronger levels. This is because the "time frequency" signal is clearer and easier to listen to than during times the sun is quiet. Simply put solar flares and solar activity broadcast a stronger signal than non-solar periods.
ACE Solar Wind Speed – BE SURE TO SELECT 7 DAYS
http://www.swpc.noaa.gov/products/ace-real-time-solar-wind
Current KP Levels Real Time
http://www.swpc.noaa.gov/products/planetary-k-index
KP Levels 3 day forecast
http://www.swpc.noaa.gov/products/3-day-forecast
Solar Flux Activity
http://www.swpc.noaa.gov/products/goes-x-ray-flux
USAF Forecast Flux and KP
http://www.swpc.noaa.gov/products/usaf-45-day-ap-and-f107cm-flux-forecast
27 day KP Forecast
http://www.swpc.noaa.gov/products/27-day-outlook-107-cm-radio-flux-and-geomagnetic-indices
Kp LEVELS LAST 30 DAYS
http://legacy-www.swpc.noaa.gov/ftpdir/indices/old_indices/2014Q4_DGD.txt
Future KP Aggregative Levels
http://origin-www.swpc.noaa.gov/products/report-and-forecast-solar-and-geophysical-activity
Optical is accessible at the link below:
http://legacy-www.swpc.noaa.gov/ftpdir/indices/old_indices/
The Dow Jones is forecast to be stronger or close higher on Friday December 5th, 2014.
On Friday December 5th, 2014. The Dow Jones closed up +58.69 (0.33%). HOORAY! our new model is getting better!!!!! This was a beautiful move for the solar weather on this date as the solar wind enters a stage 2 condition green on Satuday December 6th, 2014, sending the energies back in time to Friday December 5th, 2014. This is because the emotions and energy on Saturday are reflected on Friday when KP levels are higher and the solar wind speed enters green conditions on Saturday.
The Dec 5th, 2014 forecast is based on the following solar conditions:
We are now at Period #4
KP Steady next few days (green)
KP Forecast to be at mid pleasant levels (green)
Long Term Solar Flux in Decline (Green)
KP Peaks at a low on Saturday (green)
KP is heading into a more quiet period (green)
KP stronger on Saturday (green)
2mev stronger and forecast to be stronger on Friday (blue)
Visual Solar Flux Line Steady
Optical Stronger (blue)
Solar Wind Speed at 503.7 (green)
Solar wind forecast lower into weekend (green)
Full Moon (red/orange)
We predict a weaker Dow Jones Industrial Average or for the Dow Jones Industrial Average to close Lower on Tuesday December 2nd, 2014.
On Dec 2nd, 2014, the dow closed up +102.75
Lessons learned from this forecast. KP levels were at beneficial levels. The weather change had occured on Monday, and we made the forecast on Tuesday. This Saturday Dec 6th is the next weather change so the forecast for friday dec 5th, will be posted late thursday Dec 4th, 2014.
The Dec 2nd 2014, forecast is based on the following solar weather conditions:
This cycle as of Dec 1st, 2014, started 3 days ahead of schedule, which is not uncommon in some cases as solar weather forecasting is still in its infant stages. Therefore we will start the cycle as of December 2nd, 2014.
Current position in cycle: 1
Position #4 starts on Saturday Dec 6th, 2014, with a complete flat KP activity level.
KP Peaking and heading into decline
KP forecast for mid range kp levels, but peaking on Dec 2nd
Solar wind speed 575
Heading into full moon
Possible condition yellow last 24 hours causing solar wind to jump and KP rise
Optical and X-ray dropping
Strong 2mev forecast next 24 hrs
Visual Solar flux line flat
British forecast solar flux in long term decline
Air pressure weaker
Cosmic rays flat
We predict a weaker Dow Jones Industrial Average or for the Dow Jones Industrial Average to close Lower on Friday November 21st, 2014
On Friday November 21st, 2014, the Dow Jones closed up over 90 points.
Lessons learned from this forecast on November 21st, 2014: As we have seen in previous models (See the Thursday the 13th of November 2014 forecast), when the solar wind is about to enter 350, the dow will close higher. This means that during positions 3 and 4, basing the future forecast of the dow jones will be based on the solar wind speed as it enters this range. If it enters this range for 3 or more days, the date closest to the microclimate switch point will be the forecasted date. Over the years we have observed this trend of the solar wind speed overriding aggregative KP values as well as X-Ray Background Flux levels, as it enters the end of a cycle so future forecasts will be based on this model.
Please note, this has been our best cycle forecasting so far. So our model is improving.
View the complete model further down this page.

Solar Wind Speed:
http://www.swpc.noaa.gov/ace/MAG_SWEPAM_7d.html
NOAA KP Forecast
http://www.swpc.noaa.gov/forecast.html
The November 21st Solar Forecast is based on the following Solar Weather Conditions:
We are currently in Position #4
Cosmic Rays steady (orange)
DST falling (orange)
CP values falling (orange)
Air Pressure Peaked (orange)
KP Stronger
Long Term Solar Flux has just peaked
Air Force AP forecast
21Nov14 012
22Nov14 010
23Nov14 012
Air Force Solar Flux Forecast:
21Nov14 170
22Nov14 175
23Nov14 175
24Nov14 170
Solar Wind Speed - 393.6 In Decline approaching 350 (green)
Dow closed higher on the 20th, showing that the solar wind energy at 350 has run its course.
Solar Wind Forecast to continue to decline
2mev forecast to be weaker (orange)
X-Ray Background Flux levels are increasing (orange)
Optical Increasing
KP forecast for Saturday to be more aggregative
This switch point falls on a Saturday making this forecast especially more accurate, as the energy travels back in time from Saturday to reflect the results on Friday.
The sun is the greatest teacher of all. By understanding how the cycles of its energy flow and govern life and matter, we can grow and evolve towards a better world for all. We can also learn creative methods to solve challenging problems and understand where we are headed.
So far in our current model (valid as of November 22nd, 2014) the forecasting procedure consists of the following format:
Forecasting Method:
1. Plot Mini Solar Flare Cycle
http://www.swpc.noaa.gov/ftpdir/latest/27DO.txt
2. Scan for KP / Solar flux peaks. These can be found under the Air Force and British Geological Forecasts.
http://www.paradiseexcursion.com/long_range_kp_map.html
3. Narrow down the exact peak days using local weather microclimate changes.
4. Know the current position the cycle is in.
At positions 1 and 4 the Dow Jones is naturally stronger.
At positions 2 and 3, the Dow Jones is naturally weaker.
5. Make Dow Jones forecast based on the microclimate weather change based on the solar weather conditions that occur on the microclimate day.
The dow jones forecast made on Day #1 is based on the future solar weather conditions that are going to occur on Day #2. The Dow Jones forecast for Day #2, is than posted during the late afternoon on Day 1.

6. Does the KP or Solar Flux peak or Weather change occur on a Saturday?. If so the forecast is based on the Solar Weather Conditions that occur on Saturday. This means the Dow forecast is posted late Thursday afternoon for the Dow Jones position on Friday.
If the microclimate cross swtich point occurs on a Sunday, the solar weather conditions are used for that Sunday, as they will reflect the dow position on the following Monday.
7. If the KP / Solar flux peak / microclimate weather change takes place on a Sunday, the standard weekday forecasting method applies.
Below is the model summary of the solar cycle positions.
Positions 1 and 2 - More attention is paid to these particular solar positions; Stronger 2mev's (blue), solar wind speeds (350 or approaching 420. 420 is valid only after high solar wind speeds) KP levels. If any of these are out of tune, than the dow will close lower or be weaker for the day.
Position #1. As position #1 approaches, look for the microclimate weather change ahead, higher or lower cosmic rays and higher or lower 2 mev s. These will all occur within 24 hours of each other (with the possible execption of the cosmic rays). You can then use this to know when the rise/increase in solar flux will occur.
Seasonal Indicators: Spring
Day 1 * Day 2 * Day 3
Research day based on Forecast Day Microclimate day
solar weather on day 3
These position changes can be forecasted on advance based on microclimate weather changes.
Each Cycle contains the following Positions:
Position #1 - Increasing Solar Activity
Position #2 - Solar Activity Constant
Position #3 - Solar Actiivty Peak
Position #4 - Solar Activity in Decline
For those of you who are new, I strongly recommended reading the condition colors page at ez3dbiz.com, first to get a primer what these elements mentioned in this model mean.
Energy Position Guage
These are mini flare cycles. We all know that the sun has 11 year peaks of solar activity. Within these 11 year peaks are mini flare cycles. Positions 1 through 4 follow (A period just after higher solar activity) the cycle of the sun's solar activity, starting at a low level through to a high level. In most cases, when the solar flare cycle is between positions 3 and 4, the Dow Jones Industrial Average will be stronger or closer higher and when it is in position 1 it will also close higher, or show stronger activity.
Archive of periods after higher solar activity
http://www.swpc.noaa.gov/alerts/archive.html
Each mini flare cycle lasts either 4 days or 8 days.
As the mini flare cycle goes from position 3 to 4 (see image further down on this page) , we can use more earth related indicators to get an idea of the future of the Dow Jones. These include;
Air Pressure
Rebound Stronger Dow
No Rebound - Weaker Dow
http://meteo.lcd.lu/today_01.html
CP Values
Below 0.2 or dropping will result in a weaker dow or the dow jones closing lower
http://www-app3.gfz-potsdam.de/kp_index/qlyymm.html
Incoming Cosmic Rays
Increasing - Stronger Dow
Decreasing - Weaker Dow
Thule Station: http://neutronm.bartol.udel.edu/realtime/thule.html
Rome: http://neutronm.bartol.udel.edu/~pyle/Spectral.png
Microclimate Switch Points
What is a microclimate switch point? It is when the local weather changes. It may change from dry to wet, cool to warm, calm to windy or any other manner of conditions. This will also be reflected in a change in the sun's solar flux, higher or lower. The future forecast for the Dow jones is done 24 hours before a microclimate switch point takes place. In some cases, the weather will have to be closely watched for the upcoming microclimate switch point, because it can "jump" a day ahead of the forecast. We can get a rough idea because the 2mev levels will be stronger around this period. A sudden rise in the 2mev levels or a sudden drop will sometimes mirror the upcoming microclimate switch point date.
At the forecasted KP point date the weather will change 24 hours before OR after this date, signifying a true microclimate switch point date. This will conform that the dow will be influenced by the current existing solar weather conditions 24 hrs ahead. Forecasts made without this switch point date are almost impossible to predict. Think of these as mini wormhole windows that open up allowing the information come through more strongly at these times than at other times.
As we can see from the image below on the forecasted date of the KP activity, the weather temperature and wind changes. This is a sign of a strong switch point occuring. The Red circle shows peak of KP activity (position 4) and going into decline. The purple circle shows a peak in Solar Flux Levels and going into decline (position 4). Sometimes these peaks occur on the same day, at other times a few days apart, but we know when they occur, because there will always be a change in the local weather within 24 to 72 hours. For more info you can view our microclimate article.
As the image above shows, the forecast is made 24 hours before the actual change in the weather (microclimate switch/cross point). So a forecast is made using the following format:
1: In a solar mini cycle, we look at the weather forecast for a change in the weather 3 days ahead (as shown by the yellow dot titled: THE FUTURE in the above image).
2: On day 1 of 3, we look at where the solar weather conditions are headed for the next 24 hours.
3: A forecast is made on day 1, twenty-four hours in advance based on the solar weather conditions for the next 24 hours.
In some cases the local microclimate weather will change every 48 to 72 hours indicating multiple position changes within a week, allowing for more accurate forecasts.
Time Momentum
Right at the microclimate switch/cross point position, the position of the Dow will be based on the solar weather conditions. It is much like a portal, wormhole opens up and 'stretches' time forward solidifying the future results for the next 24 hours. Think of walking into a bubble at this microclimate switch/cross point, and that bubble carries you through to a new location. As the bubble bursts you find yourself in a new location. This is simlar to how the energy works in this model.
Tools Used For Solar Weather Forecasting
The Solar Wind
The first magic key to all forecasting. Right where the microclimate cross point occurs, the solar wind will intersect with it either at a high speed or low speed. There are 2 levels of solar wind speeds that cause the Dow Jones to be stronger. The first is around 350, the second is after extreme high solar acitivy, where it starts to decline towards 420, this is known as "cooling solar winds". Levels above this or "hotter solar winds" will result in a weaker Dow Jones Industrial Average.
More In-depth Information about secondary energy levels
Each condition color within this cycle can have 2 levels associated with it. The first level is the standard condition color levels, such as condition green with solar wind speed at 350, condition blue with increasing sunspots etc.
The second level is when the solar wind and sunspots exhibit the same behavior, but at much higher energies. This is most common when the S Optical solar flares are increasing or at high levels and most common from June to October of each year, the peak period of solar activity. In this case the solar wind can be declining for 3 days in a row and have solar wind speeds at 410 and be a level 2 condition green. The solar flux levels will increase when 2mev levels are shown to increase, showing a level 2 condition blue and so on
This means that there are also higher X-Ray Background levels which occur between 3.0 and 4.0 or 6.0 and 7.0. Depending on the position of the solar wind and KP activity, we can get an idea of the strength of the future vitality of the dow jones will be.
KP Activity
This is the second magic key to knowing in advance the result of the Dow Jones Industrial Average. KP acts as a motivator and causes people to buy or sell. In most cases at a peak, when a cross point occurs during this period, the Dow Jones will close higher or be stronger. If it peaks on a Saturday it will close higher on Friday. The opposite is also true, at a very low of KP activity, such as during positions 3 and 4, the Dow will close lower or be weaker, especially if this occurs on a Saturday; this however is dependant on the solar wind speed and X-ray Background Levels.
KP activity, like the Solar Wind contains 2 levels of energy that cause a stronger dow jones. The first is when the KP activity is in mid-range, or just after a period of higher solar activity. In NOAA forecasts it is expressed as:
Active 25/25/25
Minor Storm 05/05/05
Major-severe storm 01/01/01
B. High Latitudes Active 15/15/15
Minor Storm 30/30/30
Major-severe storm 30/30/30
If the Major Severe Storm positions are at high levels, the Dow Will close Lower. And like the solar wind, if we are entering a period where the Major Severe Storm levels have just passed, the Dow Jones will be stronger.
S Optical Flares
These are most common during the summer months in the northern hemisphere. These are an amplifier of the current sun's solar energy. So if a large number of S optical flares are falling or descending and the X-Ray background levels are above 4.0 and increasing, the dow jones will be weaker. if the X-ray background levels are around 4.0, the dow jones will also be stronger or close higher.
2mev's
These give us a rough gauge of the future of the sun's solar flux activity. A sudden rise in the 2mev levels or a sudden drop will sometimes mirror the upcoming microclimate switch point date. If they are higher, the sun's activity will increase. When we look at a forecast of the position of the sun's solar wind and it forecasts an increase or decrease, we also can get an idea of when the sun's solar flux will increase or decrease. In some cases this will also match KP activity. Another good way to use the 2mev's is that if they are forecasted to be lower the next 24 hours, the X-Ray Background Flux levels may also be lower the next day.
X-Ray Background Radiation Levels
The 3rd magic key is the X-ray background radiation levels. The X-ray background radiation levels also have 2 levels of energy like the Solar Wind Speed and the KP Energetic level. The first is when the X-ray Background Levels approach 4.0 the Dow Will be stronger, the second energy point is when the X-ray background level is between 6.0 and 7.0. This is especially so when the X-ray background level starts to “cool down” like the solar wind, as it approaches these numbers. When the x-ray background radiation first goes above these numbers the dow becomes weaker or closes lower. This higher energy spectrum is interesting because in a previous article about time, it is a period where world records are broken more often. In msany cases if the 2mev forecast is for lower 2mev's the next 24 hours, than the X-Ray Background Flux Levels may become lower.
So in summary we have 3 main points that are key to forecasting the future dow jones. 1: The Solar Wind. 2: Kp levels 3: X-ray background radiation levels.
The Planets and their effects
The Moon
New Moon - higher dow - solar wind speeds decline faster
Full Moon - lower dow - solar wind speeds last longer
The Planet Mars
Mars recently approaching 19 to 24 degrees - Lower
Leaving Mars Leaving 24 degrees - Higher
http://www.paradiseexcursion.com/mars_positions.html
The Planet Saturn
Saturn at 19.5 degrees - Lower - NOT A MAIN INDICACTOR, BUT DOES HAVE SOME INFLUENCE
Solar Eclipse occurring within 30 days will cause a weaker Dow Jones
Solar Eclipse Dates
2015 Mar 20
2015 Sep 13
2016 Mar 09
The Coming Weekend
When a Cross Point falls on a Saturday, especially if KP levels are in a beneficial range, the result will travel back in time to Friday.In most cases at a KP peak, when a cross point occurs on a Saturday, the Dow Jones will close higher or be stronger. The opposite is also true, at a very low of KP activity, such as during positions 3 and 4 (the ending of a mini solar flare cycle), the Dow will close lower or be weaker, especially if the cross point occurs on a Saturday; this is highly dependant on the levels of X-ray Background Solar Radiation.
The Condition Yellow Period
These periods occur on average every 11 days. During this time there is an unexpected "jump" or rise in sunspot activity and KP activity. These periods must be watched with care because if there are higher Optical levels, they can cause the Dow to become weaker. The best and most accurate forecasts occurs after a condition yellow, because they are less likely to occur again for another 11 days. The energies of a condition yellow are strongest within the first 6 hours, than fade.
http://www.ez3dbiz.com/in_depth.html
Link to NOAA Forecast of Solar Sunspot Activity
|
Main Instrument Panel
Solar Wind Panel
|
|---|
New Article by ez3dbiz.com:
Particles and Mass
Dr. John Cramer, professor Emeritus of Physics at the University of Washington thinks we must think about time travel in baby steps. One possibility is to start with messages traveling through time.Dr. Cramer is currently working on the possibility receiving a message milliseconds before it's sent.
Is time travel possible? Can we send messages back in time? Can we talk to our future selves?
The WIM Formula
This is one of our earliest formulas used to access information through wormholes. Wim is short for Wormhole Information Matrix. The formula is expressed as follows:
For a condition blue or Green and the Dow Jones to Close higher the Following Trading Day
A + M = Z. A is dependent on the amount of energy received by Z, in order for a clear information to be obtained. Where A represents a Peak in KP activity and M represents the condition color and Z the peak in 2mev or stronger solar flux periods that cause a condition green or blue to occur.
M is dependent upon the complete peaking of energy expressed by Z, in order for change of a condition color to blue or green to occur.
For a condition orange, red or purple or the Dow to Close Lower the Following Trading Day
Z can be interchangeable, having quantum properties, in that when Z becomes less stronger (dropping sunspots) and A shows a strong peak, M, representing the condition color will change to Orange, Red or Purple.
This means the ever changing state of M, not only contains quantum values, but is dependent on the sharp peaks expressed by both A and Z.
Where a condition yellow fits into this needs further research. Also Z, may also include 2mev particle peaks, although further research is needed to add this to the WIM Equation.
Additional Resources:
Sources:
Solar Flux Warehouse:
http://www.swpc.noaa.gov/ftpmenu/plots/xray.html
Real Time 2mev protons
http://www.swpc.noaa.gov/rt_plots/elec_3d.html
Complete Solar Warehouse
http://www.swpc.noaa.gov/ftpmenu/warehouse.html
Electron Warehouse
http://www.swpc.noaa.gov/ftpmenu/warehouse/2014/2014_plots/electron.html
Recent 2mev archive:
http://www.swpc.noaa.gov/ftpdir/indices/old_indices/
Real time solar flux
http://www.swpc.noaa.gov/rt_plots/xray_5m.html
Real time electron flux
http://www.swpc.noaa.gov/rt_plots/elec_3d.html
Real Time 2mev protons
http://www.swpc.noaa.gov/rt_plots/elec_3d.html
Learn More About Wormholes
http://www.andersoninstitute.com/wormholes.html
Added November 20th, 2014.
As our model is approaching perfection, if there are any more �quirks� to further refine it, the following may be used to refine the model. As KP peaks, it �pushes� the KP energy through 24 hours ahead of the weather change. This is why the forecast is made based on weather conditions on day 2, so we can know the dow on day 3.
Positions 1 and 2:
Based on a KP peak or an upcoming or peak in KP
Day 1 � Dow Forecast made for Day 3
Day 2 � Weather Change
Day 3 � Solar Weather Conditions
Positions 3 and 4:
Based on a solar flux peak or upcoming long term rise in the Solar Flux (British Forecast) May also be based on just after a peak in KP activity. As the solar flux peaks, or is peaking, the energy comes back from the future 24 hrs before. This is why local weather microclimate weather changes are used.
Day 1 � Dow Forecast made for day 3
Day 2 � Solar Weather
Day 3 � Local Weather Microclimate Changes
Both the KP peak and Solar Flux peaks can occur together, and at times they may occur up to 72 hours apart. When they both occur together, the solar weather conditions 24 hours before will determine the future dow position.
On Wednesday November 19th, 2014, we forecast a weaker Dow Jones or for the Dow Jones to Close Lower
On Wednesday November 19th, 2014,the Dow Jones Industrial Average closed down 2.09 (0.01%)
This is based on the following Solar Weather Conditions
Microclimate Swtich Point Change on Thursday November 20th, 2014.
Solar Wind Speed 428.6
Stronger 2mev
Optical Dropping
DST medium
Air Pressure Rebounded
KP Aggregative
Cosmic Rays Weaker
CP Values Weaker
Summary: The stronger Dow that usually occurs after higher solar activity has passed quicker than usual, due to the stronger KP activity and higher solar wind speeds. . This is especially true for the first stage condition green solar wind speed, which has now passed.Also the air pressure has already rebounded and CP values are starting to drop.
Tuesday November 18th, 2014, we forecast a stronger Dow Jones or for the Dow Jones to Close Higher.
On Tuesday November 18th, 2014, the Dow Jones Closed Up +40.07 (0.23%)
This is based on the following Solar Conditions:
Entering favorable solar wind speeds
Air Pressure Rebounding
Stronger CP values
Monday, November 17th, 2014, we forecast a weaker Dow Jones or for the Dow Jones Industrial Average to close lower
On Monday November 17th, 2014, the Dow Closed Up 13 points
This is based on the following Solar Weather Conditions:
We are approaching position #3 in the cycle (a peak and into decline towards the end of the week with a possible stronger dow later in the week)
Tuesday Nov 18th, Microclimate Weather Switch Point
Around the 18th, there is a Peak in Solar Flux Values. (red)
Solar Wind Speed: 540.2 (orange)
KP Forecast next 2 days - Major-severe storm 55/40/40 (orange) peaking over the long term.
Air Force KP Values Forecast:
16Nov14 020
17Nov14 015
18Nov14 012
19Nov14 010
20Nov14 008
Air Force Solar Flux Forecast Values:
16Nov14 160
17Nov14 160
18Nov14 165
19Nov14 170
20Nov14 170
Air Pressure Low and not yet in rebound
DST is lower
Cosmic Rays Rising
CP Values Rising
Optical in Decline, yet still at high levels (orange)
The forecast for the Dow Jones is for it to be stronger/close higher on Friday November 14th, 2014
On Friday the 14th of November 2014, The Dow closed -18.05 (-0.10%)
Lessons learned from this forecast: This forecast was made when no MicroClimate switch point occurred. Also KP levels were higher and in the aggregative range compared to the day before. This indicates the value of performing a forecast during the microclimate switch point days. The next microclimate swtich point is Sunday November 16th, 2014.
Further down this page titled: Model Refinement, we have added additional information about making more accurate forecasts using this switch point energy. This will help to further refine our model.
KP levels Increasing to higher/mid term levels
2MEV levels forecast to increase (condition blue period)
Solar Flux Levels forecasted to increase (condition blue period)
X-ray background flux levels in decline (condition green)
S Optical levels in decline (condition blue period)
Solar wind speed approaching 450, a stage 2 condition green
Solar wind is forecasted to slow down in the coming days
Air Pressure peak, no drop
Cosmic Rays steady (green)
CP Values dropping, but not yet at 2.0
DST levels rising (green)
There is no microclimate switch point occurring, except for the upcoming microclimate switch point on Sunday.
On Thursday the 13th of November the Dow Jones closed up +40.59 (0.23%)
We forecast a weaker Dow Jones or the Dow Jones Industrial Average to close significantly lower on Thursday November 13th, 2014. This information is based on the following
The reason we had a failure for the Dow Forecast on the 13th of November 2014, was attributed to a decreasing Optical and X-ray background flux levels; this could have been averted had we scanned the 2mev forecast, which showed decreasing 2mev levels for the days ahead. Also we missed the Solar Wind forecast due to slow down over the coming days resulting in a stage 2 condition green period. These are all indicators of a stronger dow.
This information is based on the following solar weather patterns:
As of October 13th, 2014, we are in position 1 of 4 of this mini-cycle. The wormhole information window opens late Saturday night into Sunday morning, and we have identified a microclimate switch point occurring on Friday afternoon November 14th, 2014. A Condition Yellow occurred less than 4 days ago, increasing the accuracy of this forecast.
Solar Wind Speeds above 500
X-Ray Background Flux is at extremely high levels and not in decline.
10.7cm Flux Solar Flux Levels are forecasted to increase according to BRITISH GEOLOGICAL SURVEY: NATIONAL GEOMAGNETIC SERVICE. This indicates the X-ray background flux levels will remain at higher levels for the next few days.
KP Levels are forecast to be mid-aggressive and a mild decline occurring in the coming days, not a sharp drop into favorable mid range levels with the solar wind.
2MEV levels are set to decline by the weekend.
Cosmic Rays Higher
Air Pressure – minor rebound
CP values are dropping
DST has fallen
This combined with the forecasted rise in KP levels by the weekend, will increase the severity of the Dow Jones Decline.
Quote: The Future is composed of truth; thefore one can gain strength from future information.
On Friday November 7th, 2014, we forecast the Dow Jones to be stronger/close higher on this date
On Friday November 7th, 2014, the Dow Jones Industrial Average Closed up 19.46 (0.11%)
Hooray! Our new model appears to be working well.
The Nov 7th Forecast is based on the following Solar Weather Conditions as of November 5th, 2014.
As of November 15th, 2014, we are approaching position #4, the end of the high energy cycle.
Air Pressure Rebounding
KP Positions ------------------------------
Leaving a stronger KP period and entering a more benefical KP period by Saturday
Friday KP goes into a lower position
Sat Nov 8th KP reaches a final Low
KP forecast for next few days to be of lower amplitude
Saturday is Cross / Switch / Microweather Point
CP Values higher
DST lower
Full Moon - lower dow - solar wind speeds last longer
Cosmic Rays Inching Up Higher
Solar Flux Activity Levels -------------------
Higher 2mev Forecast next few days
X-Ray Levels background flux levels Increasing
S Optical Levels Increasing
Solar Wind Speeds at 550 forecast to enter a stage 2 green by Satuday
Final Analysis, we are leaving a period of stronger KP activity (condition orange) and heading towards increased Solar Activity by Saturday (condition Blue Period), which will be a minor switch point day.
A Lower Dow Jones is Forecast for Monday, November 3rd, 2014.
On Monday November 3rd, the Dow Jones Industrial Average closed down -24.28 (-0.14%)
Our revised forecasting model has successfully yielded yet another success.
The November 3rd, 2014 forecast is based on the following Solar Weather Conditions:
Microclimate/Weather change due to occur on: Tuesday/Wednesday
overall in this cycle Solar flux is in decline
2nd and 3rd Kp increasing
right now Kp higher
air pressure approaching lower
cosmic rays are lower last few days
DST higher
coming up on 19 degrees mars in 5 to 7 days
solar wind speed currently at 500
by nov 4th and 5th solar wind forecasted to enter 350, possibly leading to a higher dow by Wednesday, if cross point/switch point occurs during this period
X-ray Background flux is decreasing
S optical and C Class are in decline
Solar flux Red line is showing quieter activity
2mev's are lower with forecasted lower 2mev activity. This means that no condition blue / higher sunspot activity is forecast during the cross point/switch point , especially because the S Optical and C Class flares are at a lower threshold
KP forecasts are for higher/agitative energy from 1st to 3rd
KP is entering new stronger KP activity, not lower or mid-range
The Dow Jones Industrial Average is expected to be stronger/close higher on Monday October 27th, 2014
On Monday, October 27th, 2014, the Dow Jones Industrial Average opened at 16796 and closed at 16818, closing higher for the day. Our forecast was 100% Correct for this day.
On Tuesday, October 28th, 2014, the Dow Jones Industrial Average closed higher.
The forecast for the Dow Jones on October 27th was based using our new model. This is due to solar wind speeds entering 350 with a microcimate switch point occuring on Tuesday October 28th, 2014. Because there is a microclimate swtich on Tuesday, the Dow May Close lower, although this is not 100% confirmed. The Monday forecast was based on the following Solar Weather Conditions:
Oct 26th/27th, 2014 - Decreasing flux, Increased KP
Right Now Moderate KP
Air Pressure - Peaking
New Moon - higher dow
DST and Cosmic Rays - SLower Rise
CP Values rising
Microclimate - Tues/Weds
Solar Wind Speed 362
Forecasted decline in solar wind speeds
Solar Flux Rising
2mev's higher
X-Ray Background Flux Rising
17 S Optical last 2 days
KP headed towards more moderate after higher activity
A note about weekends and forecasts
Because the dow forecast works based on momentum of solar weather at the cross point/swtich dates, forecasts for Mondays are extremely difficult because this momentum has not built up yet, which is why cross points that occur on Saturdays are reflected on Fridays.
Update: October 25th, 2014
So far, this new model appears to be doing very well. A graphic/image of the model appears below.
To find out times of higher solar activity, we can visit the address below. http://www.swpc.noaa.gov/ftpdir/latest/27DO.txt
Periods of higher solar activity will show that the Planetary A Index and Largest KP Index values will be higher. This represents a cycle will show going from lower to higher values.
What is a microclimate switch point? It is when the local weather changes, which will also be reflected in a change in the sun's solar flux, higher or lower. The future forecast for the dow jones is done 24 hours before this change takes place.
On Friday the 24th of October, the dow jones closed significantly higher. This was due to the cross point occurring on a weekend, which shows the results on Friday.
We forecast a lower dow jones for Thursday October 23rd, 2014.
The Cross Point "jumped" a day ahead because weather forecasts indicating micoclimate changes were updated a day earlier and solar flux and Kp activity also jumped a day ahead.
One thing about time, is that it seems to act in "jumps". Because we had a forecasted switch point for today, all indications, including microclimate and solar flux changes occured on Tuesday night, instead of the forecasted Wednesday. Therefore, we have now gone past our flux switch point. Because this is cycle related, we forecast a lower dow jones for Thursday October 23rd, 2014.
The Next cross point / switch in this cycle is due to begin between October 25th to October 27th, over the weekend. This is based on future microclimate weather changes and a drop in Solar Flux levels. This will be the period where the Dow rises after stronger solar activity has passed.
We forecast a Weaker Dow Jones or closing Lower on Thursday October 23rd, 2014. This is due to the switch point occurring during 3 days or more of high speed solar winds, high KP values and lower solar flux values (2mev drop), due to coming out of a condition blue when the cycle started.
Forecasting is performed according to the following:
Microclimate, Solar Flux Change / Cross Point Occurs on Thursday, so the forecast is performed on Wednesday.
New Article:
Particles and Mass
Analysis of Dow Jones Forecast for October 21st, 2014.
At 24 hours before this cross point / microclimate / solar flux change, solar activity was increasing (condiiton blue period)
A valuable lesson was learned this forecast period. At the microclimate switch point / Solar Flux Change, the position of the dow that occurs right at this point will carry on through for the next 48 hours ahead, regardless of solar wind speeds, and forecasted KP levels. This cycle usually lasts 3 to 4 days maximum.
S Optical levels were also increasing during this time period.
This valuable observation will be incorporated into our new model and used for future forecasts. Also the future forecast always begins 24 hours before the actual switch point date occurs. This gives us a valuable tool to predict the future dow jones.
Because the Solar Wind has unexpectedly reached high speeds of 500 or more overnight, and KP storm levels for Tuesday are forecast to be in the excessively high range of a Major-severe storm at 45/40/40 and the cross point microclimate solar flux change has already occured, we forecast a lower dow jones on Tuesday October 21st, 2014. Thsi puts us into day 2 of the 4 day cycle which began just before the microclimate solar flux change.
Because the Solar Wind has unexpectedly reached high speeds of 500 or more overnight, and KP storm levels for Tuesday are forecast to be in the excessively high range of a Major-severe storm at 45/40/40 and the cross point microclimate solar flux change has already occured, we forecast a lower dow jones on Tuesday October 21st, 2014. Thsi puts us into day 2 of the 4 day cycle which began just before the microclimate solar flux change.
On Monday, October 20th, 2014, the Dow Jones Closed Up +19.26 (0.12%)
On Tuesday October 21st, 2014, the Dow Jones closed up +215.14 (1.31%)
On Monday and Tuesday October 21st, 2014 The Dow Jones Industrial Average is expected to close higher or to exhibit stronger activity during these 2 days. This is due to the following solar conditions:
Monday Evening change in the temperature (microclimate)
X-Ray Background Flux in Decline
Seven S. Optical Flares
Sunspots Increasing
Solar Wind Speed going into Decline due to enter 350 by Tuesday morning
Solar Wind Speed Forecasted to Decline
The Dow Jones is expected to Close Higher on Thursday October 16th, 2014. This is due to a change in the sun's frequency, indicated by an increase in the 2mev levels along with a change in the local weather microclimate region. This change in frequency is occuring during an increase in 2mev levels and an increase in the x-ray background flux as it occurs below 4.0 (green), along with a declining solar wind speed (green). This makes for a small cross point opening period. At this cross point junction, the positions of solar wind speed and x-ray levels have their most effect on the future outcome of the dow jones.
Analysis of the Dow Jones Foreasting model put forth from October 16th, 2014 to October 17th, 2014.
This was an excellent example of a cycle that occured directly at the solar flux cross point/microclimate. It began with a slighly stronger dow on the 16th, and ended with the dow closing up over 200 points on the 17th, A FRIDAY. Let's take a look closer at the cycle.
Frequency - At the point where the solar flux / microclimate weather changes a new cycle begins, which is really a change in frequency. The future position of the dow will depend on the position of the solar wind (rising or falling) and the X-ray background flux amounts (rising or falling) exactly at where this frequency starts. The Optical and C class flares are an amplifer of this energy, and are a way to leverage this frequency.
As this cycle begins, it lasts a maximum of 4 days or until the weekend. For example if it occurs on a thursday, than the cycle will end on friday.
Other clues are: Just after stronger Kp activity and the Kp starts to decline or get "weaker" this results in a stronger dow.
If the solar wind has been at high levels and is starting to fall, and the x-ray background flux levels are in decline, this results in a stronger dow, especially if the Optical or C Class increases, which leverages this energy more.
Recent or first time X-ray background levels above 4.0 will result in a lower dow, if teh solar wind is at high speeds or increasing.
The x-ray background flux acts as an amplifer to the optical or c class flares.
Descending x-ray background flux levels will create a stronger dow as long as the solar wind is in decline or at 350.
Additional Details:
Cross points are almost impossible to predict. Instead it is best to watch out for the Dow 50% Breakout point and more activity especially as the solar activity increases, especially as the xray background flux rises above 4.0. These are times that the dow jones activity goes towards higher extremes. As the background xray levels start to drop, it is key to watch for a reversal in the dow jones as it begins to rise. Condition Blue Period 1
–
As X-ray background levels begin to drop, and the 2mev levels start to rise, along with cooling solar winds, the dow jones will become stronger. If the xray levels start to rise above 4.0 and there are more optical flares and higher solar wind speeds the dow jones will start to fall. If the dow starts to show small changes rising or falling it will become amplified in that direction according to the above solar information. The enxt 3 days should follow that cycle. Especially if it goes past a 50% breakout point. The cycle will be 4 days strong dow or 4 days weaker dow. Day 1 of cycle will set the trend for that cycle.
Because we know for a fact that local weather changes (microclimates) occur when there is a change in the sun's solar flux, we will be watching for changes in the local weather signalling a change in the dow jones cycle.
We can also use 2mev values to get an idea of when the sun's energy changes from high to low or low to high during this cycle.
The pattern to watch for will be for when the dow shows stronger resistance, as this cycle begins, especially when it closes above its previous high during this cycle.
The Cycle
The cycle that occurs in the flare shows the Dow Jones decreasing or increasing in any 4 day given cycle.
To confirm when the cycle begins, we can use the sun's solar wind and KP forecasts to determine the times this cycle begins.
What we can say is the reason the dow declined during this last forecast (sep 30th) was because there were more C class flares and the X-Ray Background Flux went above 4.1 (condition red period). It was the increase in solar activity S Optical Class flares the amplified the condition red period. (x-ray background flux levels). After these high S Optical flares ended around October 2nd, the dow started to rise (condition green period). So the Dow is expected to be stronger from October 6th to October 7th, 2014.
It appears our model still needs some work..............
Monday September 29th, 2014, we will forecast the Dow Jones position for Tuesday, September 30th, 2014. This will end the current sub-cycle. The next Sub Cycle is due to begin between October 6th and October 8th or October 12th, 2014 and October 14th, 2014, depending on the supercomputer forecast. Stay Tuned for exact dates..........
Published September 30th, 2014


This means that there could also be higher condition red frequencies, which occur between 3.0 and 4.0 or 6.0 and 7.0 and higher condition blue frequencies which occur due to peaking 2mev levels. This follows the same pattern as a solar cycle with it's sub-cycles that are contained within it. So this needs further clarification.
Analysis for September 25th and September 26th, 2014.
This model appears to have a better success rate and we are going to continue using it from now on.
On September 25th, 2014, the Dow Jones closed down over 100 points and on September 26th, 2014, the Dow Jones closed up over 100 points.
On Wednesday September 24th, 2014 a Condition Yellow Occurred. This had the result of pushing the solar wind speed back up to above 350 or into the range of a condition red/orange.
A condition yellow can alter the course of a sub-cycle, temporarily turning it into a short term condition red/orange, usually lasting no more than 24 hours.
We can plot these unexpected condition yellows occurring in the future by watching for a spike in the KP levels, and also watching the forecast levels of KP activity forecasted by NOAA,
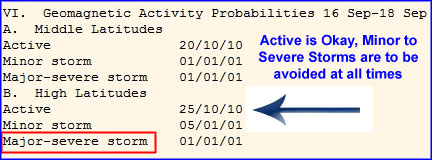
Link for Above:
http://www.swpc.noaa.gov/ftpdir/latest/RSGA.txt
The thing to remember is that the higher levels (Major/Severe Storm) forecasted by NOAA will cause the Dow Jones to Close Lower, especially if a condition yellow has just occured.
One very important point to remember, is that after high KP levels, the following lower KP period which occurs a few days later, is a period when the Dow Jones industrial average will close higher, because excessive KP levels cause a condition red to occur, as shown in the image below, the blue circles represent the moderate KP levels.
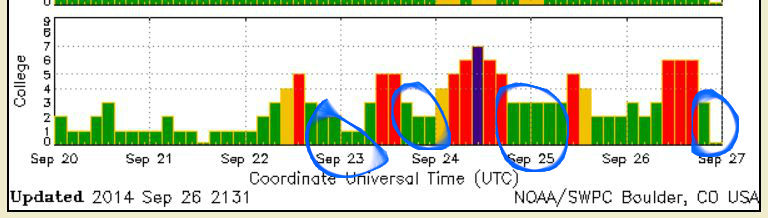
On September 26th, 2014, because it is so close to a new moon, the solar wind speed declined faster than usual after the condition yellow and the 2mev electrons were higher. In most cases a new moon causes lower solar wind speeds. This contributed to the condition blue period that began when the condition yellow occurred on Wednesday. As of Friday there were 25 S Class solar flares, showing that the condition blue was well underway, contributing to a higher Dow Jones on Friday. Solar wind speeds on Friday were at 445, leading us to conclude that the moderate KP levels were what contributed to a stronger Dow Jones on Friday, September 26th, 2014. The condition yellow seemed to act as a type of "interference" in the subcycle.
So in closing 2 valuable lessons were learned from this forecast.
1: A sudden jump in KP levels, solar wind speed levels and solar flux levels (condition yellow) can cause a weaker Dow the following trading day and is only temporary.
2: KP levels, that occur just after a strong period of high KP activity and are more moderate can cause a stronger Dow Jones under the right conditions and can override the solar wind speed when the conditions are right.
Forecast For the Dow Jones for the week of September 22nd to 27th, 2014.
Cycle #1 starts when Solar Flux Levels begin to rise, possibly starting Tuesday, Wednesday. KP Levels are due to Peak this Friday and Saturday. This Peak in KP Levels will occur during a Decline in Solar Wind Speed. High KP levels are due to start peaking on Wednesday, September 24th, 2014. Because this date is NOT A CROSS POINT DATE, (solar flux is increasing, rather than peaking) there is forecasted increased Solar Flux, meaning a strong condition blue period will manifest during this time, also contributing to a stronger Dow Jones towards the end of the week. As of September 22nd, 2014, solar flux values are flat (condition purple). Because solar wind speeds are forecast to decline, KP values will likely be moderate, leading to a condition green. Also KP values also peak on Saturday, meaning a the Dow Jones likely will close higher on Thursday, September 26th and Friday, September 27th, 2014. There is also an upcoming Solar Eclipse on October 23rd, 2014, which is usually associated with a lower Dow Jones during October of this year.
..............Stay tuned for more forecasts in the days ahead.
Solar Eclipse Dates
2014 Oct 23
2015 Mar 20
2015 Sep 13
2016 Mar 09
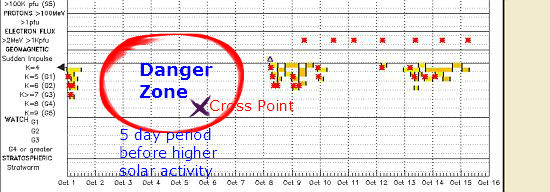
Because the solar wind is going to enter the range of 350 at this cross point date, the DOW Jones will close higher between the 24th and 26th of September 2014. Because this will be on a weekday, it should make for an accurate forecast. The exact date will be posted before the 24th of September 2014.
Using our new Model, we make the forecast that the Dow Jones Industrial Average will close Lower on Monday, September 15th, 2014.
|
Higher 2mev + Entering 350 Solar wind = Green
|
Solar Wind Panel |
| Forecasting 350 Solar Wind Speeds for an upcoming condition green period. A decline in the solar wind from high speeds, entering 350 on the day KP levels peak will indicate a green period. This is sometimes accompanied by an increase in 2mev levels, adding a condition blue. |
2mev Panel |
Orange and Red = Dow Closes Lower
| Extreme KP Levels Forecast with higher 2mev's. Solar Wind will Jump on 2mev Forecast Day = Orange |
KP Forecast Panel |
| By using our information, we can know in advance when the KP levels are going to be above average, the Solar Wind Speed is going to be above 350 and when the 2mev levels will increase |
Long Range KP Panel |
All other peaks in KP activity that don't match the above 2 requirements,
use the fine tuning.html variables for forecasting.
Future KP Levels and Real Time KP Levels
http://www.paradiseexcursion.com/kp_forecasting.html
2mev Panel
Monday September 15th, 2014. Higher Kp Activity is forecast again, with possible lower solar wind speeds. This may be a period for a stronger Dow Jones. Stay posted for confirmation on
Dow Forecasting Techniques and Exercises that Help Boost Intuition When intuitively seeking the position of the dow, besides the proper celestial positions, I have had remarkable success supplementing the sessions using Essential Oils. Not just any type of essential oil, but the essential oil that corresponds to the moon phase. This is covered more in-depth on the ez3dbiz.com website. http://www.ez3dbiz.com/essential_oils_and_intention.html During periods of intuitive peaks, you can use this simple technique to pick winning stocks. 1: First write the name of your stocks on a stack of cards. Be sure the reverse of the cards is blank 2: Turn the cards over so the other side of the card is blank 3: Before you go any further, imagine yourself clearly connecting with a universal source of information. Create a clear image of this universal flow of information and get a feeling for this flow. See it flowing from the universal source to you 4: Next pick up one of the overturned cards, but don't turn it face up to reveal the stock yet 5: Instead close your eyes, imagining the movement of this stock as it moves over a period of the upcoming 4 to 12 weeks. To help you picture the stocks movement clearly, you can imagine this activity as a graph displayed on a screen or similar viewing device. 6: Next write your "viewing" results on the blank side of the card, while keeping the card face down (don't look at the name of the stock just yet) 7: Now perform the same method with the remaining cards 8: Now once you have labeled all the cards with your intuitive impressions, look at the results, and pick out the stocks that show the strongest activity. 9: Next track the chosen stocks in the weeks ahead Notice the feelings you feel when you see the stocks name and compare it to what you visualized. If you get a strong psychic impulse or urge to buy a stock, it is overly obvious it is a gift from the universal supply of abundance so act on it before the opportunity is lost. At times before you do a intuitive "stock scan" there may be a feeling of "drudge". This is caused by an event that will affect your emotions in the near future such as a flat tire, an emotional event or a unexpected bad weather or similar. In cases your intuition tells you that it is a bad decision, resist the urge for the ego to take over and instead let go temporarily without giving up. Some of you may experience De Ja Vu, when first learning to access your intuition. What is De Ja Vu? De Ja Vu is an opportunity for additional knowledge about ourselves and others. It is a signal to pay special attention to receive a specific lesson in a certain area or complete what is not yet finished. Following intuition does not always feel good. At times it may seem difficult and entail arduous work. At other times it may be effortless. Enjoying the creative resources of intuition is based on the intrinsic satisfaction of expanding consciousness, taking responsibility for your life, and surrendering to your own true nature. Taking a tincture or tea of Rhodia Rosea at 3 p.m. the day of exercise and Passion Flower tea the night before works well. __________________________________ Tips to Enhance Intuition Worldwide psychic research data from more than 50 years show conclusively that our awareness is able to transcend distance and time, and come back with useful information. This occurs best when the right conditions are present. Scientific studies conducted at leading universities find that people give more accurate psychic readings in distraction-free rooms that are dimly lit and have soft background music. Learning to quiet the mind is therefore part of the training for awakening intuition. Create an atmosphere that amplifies your psychic abilities. Intuition flourishes in silence. Your room environment can contribute or detract from your psychic abilities. Create a quiet environment. Learning to be quiet and receptive allows intuition to unfold. Too much activity or conscious programming gets in the way of intuitive awareness that emerges when a receptive attitude is cultivated. Once you set the intention to tune into and notice your intuition. your intention must mesh with what you are focusing on. Tapping into intuition goes hand in hand with increasing your awareness. Time in nature is another great way to increase your awareness. Seasons and Intuition Because the peak periods and the 1 to 5 days after a peak in geomagnetic activity are the peak intuitive periods, we can calculate the seasonal periods. Geomagnetic storms peak twice per year. During Spring and again six months later during fall. So during geomagnetic storms in spring and fall and the following 4 weeks thereafter are seasonal intuitive peak periods. Additional Intuitive Boosters Taking Ormus with Rhodia Rosea The last 3 days before and after the full moon. From my personal experience, the period around a full moon provides a medium boost in intuitive abilities. There are also scientific research articles showing that around the full moon there is a slight increase in geomagnetic activity. Below is a scientific study showing that geomagnetic activity increases after a full moon. "The geomagnetic field is typically about 50 μT (range 20–90 μT). Geomagnetic activity generally decreases by about 4% for the seven days leading up to a full moon, and increases by about 4% after the full moon, lasting for seven days. " Scientific Paper available at: Using a Crystal to Enhance Intuition Holding or wearing a quartz or citrine crystal look or imagine the pointy tip of the crystal. Next just outside of this tip, imagine your goal, such as a successful intuitive reading, next see this goal passing through the very tip of the crystal, passing out to the other side of the tip of the crystal and than hold the image as long as you feel comfortable, than release and let go. The wrong Dow answer in a scan or lower Dow will leave you with a sinking, empty feeling. As you collect your data, your scan will give you the intuitive answer. This is your intuition signaling you. If the information passes you 3 times in a short period of time and grabs your attention 3 times, pay extra attention to it. When the desired goal and researched information come together an in we feeling of rightness will appear. After you have developed your sense of Intuition Once you are able to access your intuition on demand, or during times when it is naturally enhanced, you will start to act as a fighter who feels a sense of flow, emotionally feels attuned to the situation, and is responding to information in an organic and harmonious way. You will begin to understand that it is not the slower, clumsy, cumbersome analytical processes of the cognitive mind that slows down action, but internal emotion that gets results. After you have mastered your intuition, any charts, graphs and equations become irrelevant. Only emotional feeling is necessary to obtain the answer(s). Dealing with the Ego Once we have gained consistent results from using our intuition, the ego may try to get in the way. As your intuition begins to improve, be sure to guard your thoughts so that you don't fall into the trap of believing you have special powers. This sort of belief will trigger your ego-self to take over, and your psychic abilities will automatically reduce as a result.Any time we declare the ego as a real state of being, we give power and life to the illusion. Watch out for the "special power" ego trap. Avoid identifying with others' egos. You can use this exercise to help calm down the ego: Save this website in PDF or print at: The Significance of the Number 4 April was the best month of our remote viewing results. 8 months (4x2) from April is December the 2nd best month July happens to be 4 months from April and halfway between the positive emotions going into a low in December. Sundays and Thursdays are 4 days apart from each other. The dow jones forecasts are currently being done in a major city in the Pacific Northwest of the United States. All forecasts are based using the calculation 6.5 to 7 hours before the star Antares rises in the east. We shall call this the "emotional portal" window as we are using techniques to detect the emotions through time. (identifying positive or negative emotions as they occur in the future, and being aware of them in the present.) Between 7 am and 5 am from march to April is an emotional portal. This early morning time is the quietest period of the day, and as shown in the table earlier. It also happens to be a low of the day for positive emotion (a peak time for negative emotions). Between 2 am and midnight from November to December another emotional portal occurs. The hours between 7 am and 5 am happen to be another period when positive emotion is lowest. The hours 2 am and 5 am are exactly 4 hours apart from each other.
I have noticed that after receiving the correct answer about the position of the dow jones that it is often followed by a period of tension. It is this tension that allows the answer to become crystal clear. You must get used to dealing with this tension if you want to intuitively know the future position of the dow jones. Tension is the physical and emotional experience of expanding creative energy. Nothing is born without creative tension. You will never be comfortable with the tension until you learn how to stay with it and allow the tension to resolve itself. This is because tension shows itself at the outward appearance of a release of energy. The period just before a person breathes out a breath of air there is a period of tension. If you watch a large river, you will notice the current gets very strong just before the water turns into deeper, calmer water. A simple exercise to release tension is to breath deeply and as you breathe in, repeat the word "be" and as you exhale repeat the word "present".
Picking Winning Stocks Using Cards
Intuitive Exercise Notes
The goal of this exercise is to obtain non biased information without analytics. Emotion is key here. The right Dow answer in a scan will feel neutral, clean, smooth - in the flow. The wrong Dow answer will leave you with a sinking, empty feeling. If the emotions you receive contain excessive excitement, and excess hype, than instead base your decision on logic, as emotions decisions made out of excessive excitement and hype are usually incorrect answers.
Additional Notes on Intuitive Scanning for Stocks
Adding 4 drops of Ginseng Tincture to PassionFlower Tea
When your intuitive biorhythm is at its peak. Although I have still received good intuitive results with a low intuitive biorhythm, it does provide a slight boost.
http://www.sciencedirect.com/science/article/pii/S1756239209001190
The right Dow answer in a scan will feel neutral, clean, smooth - in the flow.
Simply focus on unconditional love using heart math. As your heart opens, so does your intuition. As you release blockages, density, limiting beliefs, doubts and fears, your vibration naturally increases and your intuition naturally opens.
http://pdfmyurl.com/