News

01-27-2013
 New Books
Visit the Books Page on the homepage to See our Latest Releases
New BooksVisit the Books Page on the homepage to See our Latest Releases
How to Find Changes in Your Local Weather Using the Sun's Solar Flux Return to Homepage
Related Articles
Is Climate Change Responsible for the 2017 Hurricanes in Texas. Louisiana, Georgia and Florida?
How Sunspots Drive Biological Evolution
Updated March 24th, 2015
How Sudden Weather Changes can be Accurately Forecasted
I want to share with you some of these secrets which I believe may help you get over the uncertainty of when the weather will suddenly change.
We have all seen the weather man/woman on TV forecasting the weather, and than a few days or hours later he/she is completely wrong. The changes in our weather are a direct result of the amount of increasing and decreasing solar activity taking place on our sun. The more solar activity that is occurring, the more dramatic and unexpected the changes in the weather. So by monitoring our sun's weather, we can get a pretty good idea of when the weather is going to change and how intense the change will be.
For example, say the weather man/woman says it is going to rain tomorrow with a 50% chance of the rain occurring. This really means that the weather man/woman is 50% uncertain that rain is going to occur. So let's take a look at the solar activity occurring.
The following image below gives a more clear illustration.
As shown above, the increasing solar activity is a time when solar activity is changing from a quiet line to a more active one. This is a period where your local weather microclimate will change.
As shown above, the line is going into a decrease and than flat. Solar activity is decreasing. This is a period once again where your local weather microclimate will change.
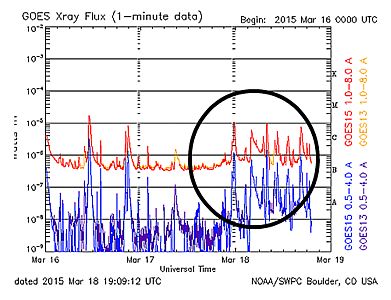
Title: Goes X-ray Flux 1 minute data
Solar Flux Link
http://www.swpc.noaa.gov/products/goes-x-ray-flux
So the line that you see is the activity of the sun. When this line gets more active after being quiet for a period of time, the local regional weather will change all over the world. This is known as the weather "microclimate".
The weather could go from hot to cold, dry to wet, windy to calm etc. But if you already know that the forecast is 50% rain, than it will go from dry to wet in the next 6 to 12 hours when the line becomes more active or the line starts to decrease from a high of activity. If there are more sunspots occuring the change will be almost sudden.
Now the opposite is also true, when the line has been active for a number of days and starts to go "calm" or "decline" the weather in your region will undergo a change again. It could be dry, than after this change, it may rain or if it has been higher temperatures the last few days, than it will get cooler or any range of weather changes. One very interesting effect of this, is that in coastal areas, especially along the northern coastline of the United States, when this "flat line" in solar activity has occurred for a number of days, the coastline will get more foggy and have more dense mist than usual.
Now as explained earlier, when the sun's activity is more active, the changes are much more severe. Just say for example the rain this past month has been mild and drizzling. As the sun's sunspot level increases, instead of mild drizzling, the mild drizzle could turn into thunderstorms and heavy showers.
Luckily, thanks to NOAA, we can plot when these periods of higher solar activity (increasing sunspots) are going to occur. As will be shown in the next illustration, the higher numbers represent estimates of days the solar activity is going to be higher than usual and the lower numbers days the solar activity is going to be reduced or lessened. The most quiet periods are the first 24 to 48 hours after entering the lowest number or point forecasted.
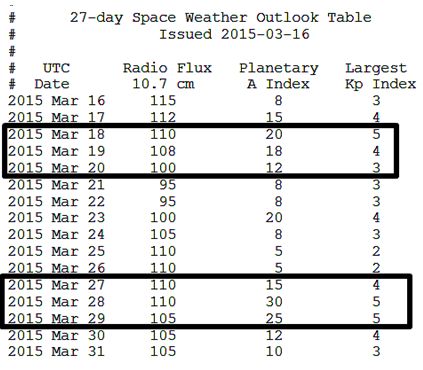
As the above image shows, periods of higher solar activity occur from March 18th to March 20th and again from March 27th to March 29th. This is because the column marked Planetary A Index has higher than normal numbers.
Title : 27-Day Outlook of 10.7 cm Radio Flux and Geomagnetic Indices
Internet Hyperlink:
http://www.swpc.noaa.gov/products/27-day-outlook-107-cm-radio-flux-and-geomagnetic-indices
Or if you don’t feel like typing in the above link, just enter into Google the search term: 27-Day Outlook of 10.7 cm Radio Flux and the page will automatically pop up for you.
Season-wise, solar activity is at its lowest from November to January, and at its highest from March to June. March to June also happen to be the months that unexpected and surprising tornadoes are most common.
Source: USTORNADOES.com
http://www.ustornadoes.com/2013/03/19/monthly-tornado-averages-by-state-and-region/
This means if you want to plan a perfect camping trip, than go when solar activity is winding down or quiet, combine this with the right moon phases, lower solar activity (reduced mosquito attacks, as we will cover later on) and you have yourself the perfect outdoor camping trip. I also suspect that some event planning companies use this same technique to plan the best time to hold outdoor parties and events.
The Below Information is the Original Article.
Sometimes it can be frustrating when the weatherman is wrong or off by a few hours or even days. One way to increase the accuracy of knowing when it is going to rain, stop raining or become cooler or drier or even winder is to watch the activity of our sun. When there is a change in the sun's solar flux, which is a measurement of the activity of our sun, changes in our local weather, known as microclimates, occur. When there are more sunspots, the weather changes faster and quicker than usual.
Visit Sunspot Activity real Time Courtesy of NOAA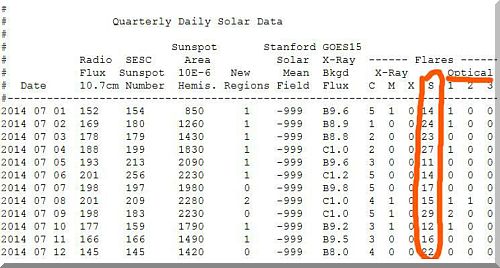 As we can see in the image on the left, the Optical Column shows a peak of 29 flares on July 9th, 2014. If the line of the sun's solar flux changed to an increase or decrease, during this time, than local weather changes would be imminent. And because there are a lot of Optical S Class Flares, the weather changes would happen more suddenly. This could explain the erratic weather changes that occurred around the year 2000, when there was a solar cycle sunspot high. And in the coming years because the sunspot cycle is declining, we should see a decrease in sudden weather extremes over the long term.
http://www.swpc.noaa.gov/ftpdir/latest/DSD.txt
The reverse is also true, when the weatherman/woman forecasts a change in the weather, than you can use this as a rough gauge to know when the activity of the sun is going to change.
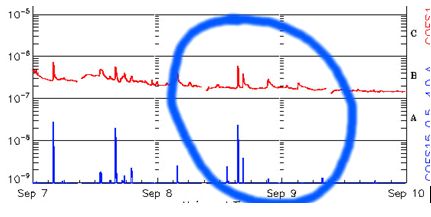
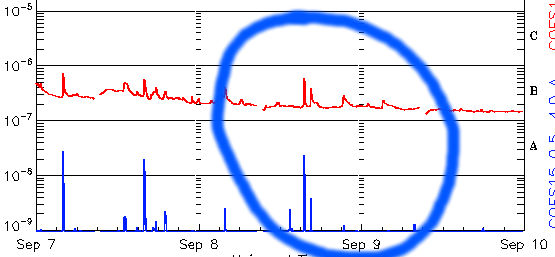
At EZ3DBIZ.com we group this into 2 conditions. Condition Blue, which is a period when the sun's activity starts to increase as shown below, and the Condition Purple, when the sun's activity starts to become quiet again after an active period, which is shown in the image on the far bottom. You can get real time solar flux activity courtesy of NOAA, by clicking on the link below.
Live Solar Flux Activity
Below is a snapshot of the condition blue period
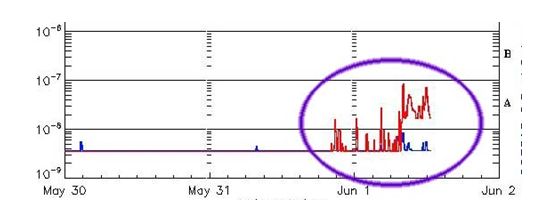
Below is a snapshot of a condition purple.
Fast Fact
One rough gauge to understand when the sun's solar flux will change, is to watch for a change in the 2mev protons. The higher the 2mev protons, the more intense the sun's solar flux. If there is a sudden peak in the 2mev protons at the peak of a cross point along with many optical flares, the weather changes will be more dramatic and sudden. Our previous article titled How to find Higher 2mev Levels can help you understand the 2mev protons further.
Thank you for watching and reading and I hope this helps us all to understand where weather changes come from.
Thank You for visiting our site and reading our articles and new update. If this information has helped you or someone you know, please consider contributing to this site. Your contribution will ensure the continued publishing of unique and quality articles at no cost to all of our visitors and regular readers.