Date of Next Posting For Information Obtained from the
Wormhole Informational Access Data Point
Next Cycle due to Begin: Next Cycle is active from Nov 12th to Nov 13th, 2014. Check back 24hrs before this date for the dow Forecast
November 6th and 7th, 2014 is the date of next cross/switch point, during this higher solar energy period. Check back on Wednesday November 5th for dow forecast
A Lower Dow Jones is Forecast for Monday, November 3rd, 2014.
On Monday November 3rd, the Dow Jones Industrial Average closed down -24.28 (-0.14%)
Our revised forecasting model has successfully yielded yet another success.
The November 3rd, 2014 forecast is based on the following Solar Weather Conditions:
Microclimate/Weather change due to occur on: Tuesday/Wednesday
overall in this cycle Solar flux is in decline
2nd and 3rd Kp increasing
right now Kp higher
air pressure approaching lower
cosmic rays are lower last few days
DST higher
coming up on 19 degrees mars in 5 to 7 days
solar wind speed currently at 500
by nov 4th and 5th solar wind forecasted to enter 350, possibly leading to a higher dow by Wednesday, if cross point/switch point occurs during this period
X-ray Background flux is decreasing
S optical and C Class are in decline
Solar flux Red line is showing quieter activity
2mev's are lower with forecasted lower 2mev activity. This means that no condition blue / higher sunspot activity is forecast during the cross point/switch point
, especially because the S Optical and C Class flares are at a lower threshold
KP forecasts are for higher/agitative energy from 1st to 3rd
KP is entering new stronger KP activity, not lower or mid-range
Within the period of high solar activity there are cross/switch points/microclimate changes. During this period of intensified energy, at these cross points is when the forecasts are made. When this higher period of solar energy has passed, the forecasts cease.
Dr. John Cramer, professor Emeritus of Physics at the University of Washington thinks we must think about time travel in baby steps. One possibility is to start with messages traveling through time.Dr. Cramer is currently working on the possibility receiving a message milliseconds before it's sent.
Is time travel possible? Can we send messages back in time? Can we talk to our future selves?
The Dow Jones Industrial Average is expected to be stronger/close higher on Monday October 27th, 2014
On Monday, October 27th, 2014, the Dow Jones Industrial Average opened at 16796 and closed at 16818, closing higher for the day. Our forecast was 100% Correct for this day.
On Tuesday, October 28th, 2014, the Dow Jones Industrial Average closed higher.
The forecast for the Dow Jones on October 27th was based using our new model. This is due to solar wind speeds entering 350 with a microcimate switch point occuring on Tuesday October 28th, 2014. Because there is a microclimate swtich on Tuesday, the Dow May Close lower, although this is not 100% confirmed. The Monday forecast was based on the following Solar Weather Conditions:
Oct 26th/27th, 2014 - Decreasing flux, Increased KP
Right Now Moderate KP
Air Pressure - Peaking
New Moon - higher dow
DST and Cosmic Rays - SLower Rise
CP Values rising
Microclimate - Tues/Weds
Solar Wind Speed 362
Forecasted decline in solar wind speeds
Solar Flux Rising
2mev's higher
X-Ray Background Flux Rising
17 S Optical last 2 days
KP headed towards more moderate after higher activity
A note about weekends and forecasts
Because the dow forecast works based on momentum of solar weather at the cross point/swtich dates, forecasts for Mondays are extremely difficult because this momentum has not built up yet, which is why cross points that occur on Saturdays are reflected on Fridays.
Update: October 25th, 2014
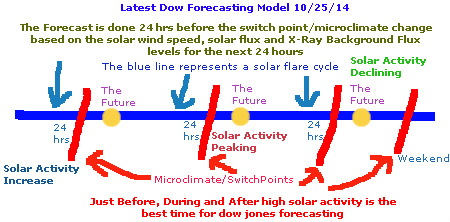
So far, this new model appears to be doing very well. A graphic/image of the model appears below.
To find out times of higher solar activity, we can visit the address below.
http://www.swpc.noaa.gov/ftpdir/latest/27DO.txt
Periods of higher solar activity will show that the Planetary A Index and Largest KP Index values will be higher. This represents a cycle will show going from lower to higher values.
What is a microclimate switch point? It is when the local weather changes, which will also be reflected in a change in the sun's solar flux, higher or lower. The future forecast for the dow jones is done 24 hours before this change takes place.
On Friday the 24th of October, the dow jones closed significantly higher. This was due to the cross point occurring on a weekend, which shows the results on Friday.
We forecast a lower dow jones for Thursday October 23rd, 2014.
The Cross Point "jumped" a day ahead because weather forecasts indicating micoclimate changes were updated a day earlier and solar flux and Kp activity also jumped a day ahead.
One thing about time, is that it seems to act in "jumps". Because we had a forecasted switch point for today, all indications, including microclimate and solar flux changes occured on Tuesday night, instead of the forecasted Wednesday. Therefore, we have now gone past our flux switch point. Because this is cycle related, we forecast a lower dow jones for Thursday October 23rd, 2014.
The Next cross point / switch in this cycle is due to begin between October 25th to October 27th, over the weekend. This is based on future microclimate weather changes and a drop in Solar Flux levels. This will be the period where the Dow rises after stronger solar activity has passed.
We forecast a Weaker Dow Jones or closing Lower on Thursday October 23rd, 2014. This is due to the switch point occurring during 3 days or more of high speed solar winds, high KP values and lower solar flux values (2mev drop), due to coming out of a condition blue when the cycle started.
Forecasting is performed according to the following:
Microclimate, Solar Flux Change / Cross Point Occurs on Thursday, so the forecast is performed on Wednesday.
New Article:
Particles and Mass
Analysis of Dow Jones Forecast for October 21st, 2014.
At 24 hours before this cross point / microclimate / solar flux change, solar activity was increasing (condiiton blue period)
A valuable lesson was learned this forecast period. At the microclimate switch point / Solar Flux Change, the position of the dow that occurs right at this point will carry on through for the next 48 hours ahead, regardless of solar wind speeds, and forecasted KP levels. This cycle usually lasts 3 to 4 days maximum.
S Optical levels were also increasing during this time period.
This valuable observation will be incorporated into our new model and used for future forecasts. Also the future forecast always begins 24 hours before the actual switch point date occurs. This gives us a valuable tool to predict the future dow jones.
Because the Solar Wind has unexpectedly reached high speeds of 500 or more overnight, and KP storm levels for Tuesday are forecast to be in the excessively high range of a Major-severe storm at 45/40/40 and the cross point microclimate solar flux change has already occured, we forecast a lower dow jones on Tuesday October 21st, 2014. Thsi puts us into day 2 of the 4 day cycle which began just before the microclimate solar flux change.
Because the Solar Wind has unexpectedly reached high speeds of 500 or more overnight, and KP storm levels for Tuesday are forecast to be in the excessively high range of a Major-severe storm at 45/40/40 and the cross point microclimate solar flux change has already occured, we forecast a lower dow jones on Tuesday October 21st, 2014. Thsi puts us into day 2 of the 4 day cycle which began just before the microclimate solar flux change.
On Monday, October 20th, 2014, the Dow Jones Closed Up +19.26 (0.12%)
On Tuesday October 21st, 2014, the Dow Jones closed up +215.14 (1.31%)
On Monday and Tuesday October 21st, 2014 The Dow Jones Industrial Average is expected to close higher or to exhibit stronger activity during these 2 days. This is due to the following solar conditions:
Monday Evening change in the temperature (microclimate)
X-Ray Background Flux in Decline
Seven S. Optical Flares
Sunspots Increasing
Solar Wind Speed going into Decline due to enter 350 by Tuesday morning
Solar Wind Speed Forecasted to Decline
The Dow Jones is expected to Close Higher on Thursday October 16th, 2014. This is due to a change in the sun's frequency, indicated by
an increase in the 2mev levels along with a change in the local weather microclimate region. This change in frequency is occuring during an increase in
2mev levels and an increase in the x-ray background flux as it occurs below 4.0 (green), along with a declining solar wind speed (green). This makes
for a small cross point opening period. At this cross point junction, the positions of solar wind speed and x-ray levels have their most effect on the future
outcome of the dow jones.
Analysis of the Dow Jones Foreasting model put forth from October 16th, 2014 to October 17th, 2014 .
This was an excellent example of a cycle that occured directly at the solar flux cross point/microclimate. It began with a slighly stronger dow on the 16th, and ended with the dow closing up over 200 points on the 17th, A FRIDAY. Let's take a look closer at the cycle.
Frequency - At the point where the solar flux / microclimate weather changes a new cycle begins, which is really a change in frequency. The future position of the dow will depend on the position of the solar wind (rising or falling) and the X-ray background flux amounts (rising or falling) exactly at where this frequency starts. The Optical and C class flares are an amplifer of this energy, and are a way to leverage this frequency.
As this cycle begins, it lasts a maximum of 4 days or until the weekend. For example if it occurs on a thursday, than the cycle will end on friday.
Other clues are: Just after stronger Kp activity and the Kp starts to decline or get "weaker" this results in a stronger dow.
If the solar wind has been at high levels and is starting to fall, and the x-ray background flux levels are in decline, this results in a stronger dow, especially if the Optical or C Class increases, which leverages this energy more.
Recent or first time X-ray background levels above 4.0 will result in a lower dow, if teh solar wind is at high speeds or increasing.
The x-ray background flux acts as an amplifer to the optical or c class flares.
Descending x-ray background flux levels will create a stronger dow as long as the solar wind is in decline or at 350.
Additional Details:
Cross points are almost impossible to predict. Instead it is best to watch out for the Dow 50% Breakout point and more activity especially as the solar activity increases, especially as the xray background flux rises above 4.0. These are times that the dow jones activity goes towards higher extremes. As the background xray levels start to drop, it is key to watch for a reversal in the dow jones as it begins to rise. Condition Blue Period 1
–
As X-ray background levels begin to drop, and the 2mev levels start to rise, along with cooling solar winds, the dow jones will become stronger. If the xray levels start to rise above 4.0 and there are more optical flares and higher solar wind speeds the dow jones will start to fall. If the dow starts to show small changes rising or falling it will become amplified in that direction according to the above solar information. The enxt 3 days should follow that cycle. Especially if it goes past a 50% breakout point. The cycle will be 4 days strong dow or 4 days weaker dow. Day 1 of cycle will set the trend for that cycle.
New Model Posted October 6th, 2014
This new model will be able to plot times where the dow is stronger over the next 3 to 4 days or weaker.
This new model takes into account the cycle of a solar flare. There are 2 cycles in a flare. The first is where sunspots increase, shown by a number in the S Optical or C Class Levels. After this peak has been reached, there is another cycle which results in the sunspots going into decline.
In most cases, as sunspots increase there is an increase in X-ray Levels and S and C Class Flares, so the dow will close lower for the next 4 days. And as the flares begin to fade, the X-ray levels will drop. As long as solar wind speeds are at lower levels ie; 350 or 450 (green or level 2 green), this is a period the dow will close higher.
What happens is that as the S optical or C Class flares increase, at the peak of the cross point activity, the dow will undergo a switch, much like the weather. Only it will go from rising to dropping, or from dropping to rising.
In the model below where estimate is used for solar wind speed, it is estimated as lower because no major flare occurred, so during this time solar wind speeds are usuall lower during this time or in decline.
Check this cycle against:
Long Bars
http://www.swpc.noaa.gov/alerts/archive.html#2014
Solar Wind
http://www.swpc.noaa.gov/ace/MAG_SWEPAM_7d.html
http://www.solen.info/solar/coronal_holes.html
If not enough solar wind archives available, than just stick with 350 as a green entering or to add more energy towards a rising dow.
Archives:
http://www.swpc.noaa.gov/ftpdir/indices/old_indices/2014Q1_DSD.txt
http://www.swpc.noaa.gov/ftpdir/indices/old_indices/
New Model may go with breakout and after 1st day of breakout, plot next 3 days or near cross point to wait until dow reversal (rebalance) occurs.
Because we know for a fact that local weather changes (microclimates) occur when there is a change in the sun's solar flux, we will be watching for changes in the local weather signalling a change in the dow jones cycle.
We can also use 2mev values to get an idea of when the sun's energy changes from high to low or low to high during this cycle.
The pattern to watch for will be for when the dow shows stronger resistance, as this cycle begins, especially when it closes above its previous high during this cycle.
The Cycle
The cycle that occurs in the flare shows the Dow Jones decreasing or increasing in any 4 day given cycle.
To confirm when the cycle begins, we can use the sun's solar wind and KP forecasts to determine the times this cycle begins.
----------------------------------------
______________________________________________________
January 2014
Flares and X-Ray
2014 01 01 160 106 610 1 -999 C1.1 3 1 0 7 0 1 0
2014 01 02 161 133 1410 1 -999 C1.5 6 2 0 5 1 0 0
2014 01 03 182 162 1570 0 -999 C1.2 9 2 0 14 0 0 0
2014 01 04 215 178 1710 1 -999 C1.7 4 3 0 10 0 1 0
2014 01 05 218 225 1790 0 -999 C1.8 3 0 0 14 0 0 0
2014 01 06 204 245 1855 2 -999 C1.1 3 0 0 6 1 0 0
2014 01 07 237 196 1850 0 -999 B9.6 8 2 1 13 1 2 0
2014 01 08 195 178 1990 1 -999 C1.0 6 1 0 8 0 0 0
2014 01 09 184 106 1960 0 -999 B7.8 2 0 0 1 0 0 0
2014 01 10 175 138 2240 2 -999 B7.1 3 0 0 2 0 0 0
2014 01 11 166 134 1800 1 -999 B7.2 10 0 0 2 0 0 0
Solar Wind Speed:
605
Solar Wind Archive:
http://www.solen.info/solar/coronal_holes.html
On Jan 3rd Dow opened and on Jan 7th, Dow Closed Higher for these 5 days.
THIS WAS S OPTICAL LEVELS
_________________________________________
Flares and X-Ray
2014 01 10 175 138 2240 2 -999 B7.1 3 0 0 2 0 0 0
2014 01 11 166 134 1800 1 -999 B7.2 10 0 0 2 0 0 0
2014 01 12 155 118 1620 1 -999 B6.7 2 0 0 2 0 0 0
2014 01 13 143 102 1350 0 -999 B6.2 4 1 0 4 0 0 0
2014 01 14 137 95 480 1 -999 B7.7 2 0 0 3 0 0 0
2014 01 15 126 87 450 0 -999 B5.6 0 0 0 0 0 0 0
Dow dropped 10th and 13th and rose from 13th to 15th
THIS WAS C XRAY LEVELS
Solar Wind Speed from Jan 12th to 14th
763
__________________________________________________________
Flares and X ray
2014 01 16 121 77 330 1 -999 B4.5 4 0 0 0 0 0 0
2014 01 17 129 95 360 3 -999 B7.1 11 0 0 0 0 0 0
2014 01 18 130 114 500 2 -999 B4.9 7 0 0 3 0 0 0
2014 01 19 128 91 530 0 -999 B4.3 2 0 0 1 0 0 0
2014 01 20 137 131 850 2 -999 B4.6 5 0 0 3 0 0 0
2014 01 21 146 141 820 2 -999 B5.0 2 0 0 1 0 0 0
KP levels
2014 01 16 2 0 0 1 1 1 1 1 0 1 0 0 1 2 0 0 0 0 3 0 0 1 1 1 0 1 0
2014 01 17 2 0 0 0 0 1 2 1 1 1 0 0 0 0 2 0 0 0 4 1 1 1 0 1 1 1 2
2014 01 18 1 0 0 0 0 1 1 1 0 0 0 0 0 0 0 0 1 0 2 1 0 0 0 0 0 1 0
2014 01 19 2 0 0 0 0 2 2 1 0 0 0 0 0 0 0 0 0 0 2 1 0 0 0 1 1 1 0
2014 01 20 4 0 0 1 1 2 2 2 1 3 0 0 3 2 1 0 0 0 3 0 0 1 1 1 1 1 0
2014 01 21 6 2 1 1 1 2 2 2 2 11 0 0 2 4 4 3 2 1 8 3 1 2 2 2 2 2 2
Dow dropped from 17th to 21st
This was higher optical levels
Solar Wind Speeds: 584
X ray rising with S optical rising + high speed solar winds......
-----------Trend continues next cycle below
flare
2014 01 26 138 109 460 0 -999 B7.9 3 0 0 0 0 0 0
2014 01 27 144 62 490 2 -999 C1.2 7 3 0 0 0 0 0
2014 01 28 157 70 910 0 -999 C1.4 6 7 0 6 2 0 0
2014 01 29 156 96 1370 0 -999 C1.0 11 0 0 7 0 0 0
2014 01 30 161 112 1470 0 -999 C1.2 6 3 0 5 0 1 0
2014 01 31 166 87 1210 0 -999 C1.0 5 1 0 2 0 0 0
KP
2014 01 26 3 0 2 2 1 0 1 1 1 4 0 1 2 3 0 1 1 0 6 2 3 2 1 0 2 1 1
2014 01 27 3 0 1 1 0 2 2 0 1 1 0 0 0 0 1 1 0 0 4 1 1 1 0 1 1 1 1
2014 01 28 3 0 0 1 1 1 2 2 1 3 0 0 1 2 0 1 2 1 5 0 0 2 1 1 2 2 2
2014 01 29 6 1 2 2 2 2 2 2 1 10 0 1 3 4 3 3 1 0 7 2 2 2 2 2 2 2 2
2014 01 30 4 2 3 1 0 1 1 1 0 1 1 1 1 0 0 0 0 0 5 2 3 1 0 0 0 1 1
2014 01 31 2 0 0 0 1 1 1 1 0 0 0 0 0 1 0 0 0 0 3 0 0 1 1 1 0 1 1
2014 02 01 2 0 0 0 1 1 1 1 2 1 0 0 0 1 0 1 0 1 5 0 0 1 1 1 1 2 3
Jan 26th to 31st dow declines
Solar Wind Speed: 473
Stronger X-Ray combined with stronger C Class Flares (red)
X Ray rising with C Class Rising + Stronger Solar Wind Speeds......
------------Trend Reverses
flares
2014 02 01 177 147 1640 1 -999 C1.4 7 2 0 7 2 0 0
2014 02 02 190 163 1890 1 -999 C1.8 10 7 0 32 3 0 0
2014 02 03 188 168 1870 0 -999 C1.6 12 0 0 18 0 0 0
2014 02 04 188 183 1970 1 -999 C2.5 12 4 0 12 3 0 0
2014 02 05 194 234 2080 3 -999 C1.5 10 1 0 14 0 0 0
2014 02 06 191 223 2630 0 -999 C1.1 8 1 0 8 1 0 0
2014 02 07 178 241 2270 0 -999 C1.2 5 2 0 14 1 1 0
2014 02 08 172 186 1770 2 -999 B9.6 8 0 0 4 0 0 0
2014 02 09 169 180 1760 0 -999 C1.1 4 1 0 6 0 0 0
2014 02 10 161 122 940 1 -999 C1.1 5 0 0 4 0 0 0
Feb 3rd to feb 11th, dow rose each day
Solar Wind Speed: 483
Analysis: Feb 4th to Feb 6th , X-Ray levels began dropping, even through S Optical was stronger. This combined with a level 2 solar wind speed (green)
S Optical Rising with X-Ray Dropping and Solar Wind Speeds in good range.............
-----------Trend Reverses
Flares
2014 02 10 161 122 940 1 -999 C1.1 5 0 0 4 0 0 0
2014 02 11 172 151 1100 1 -999 C1.3 2 2 0 6 3 1 0
2014 02 12 160 187 1260 1 -999 C1.5 5 3 0 12 1 2 0
2014 02 13 167 157 1710 0 -999 C1.8 9 5 0 16 4 1 0
2014 02 14 167 196 1785 1 -999 C1.0 11 4 0 19 2 1 0
2014 02 15 162 135 1410 0 -999 B8.3 6 0 0 6 0 0 0
2014 02 16 154 137 1410 0 -999 B7.2 9 1 0 9 0 0 0
2014 02 17 152 101 1090 2 -999 B7.8 7 0 0 11 1 0 0
2014 02 18 151 134 1300 2 -999 B9.4 5 0 0 18 0 0 0
2014 02 19 158 123 940 1 -999 B8.1 7 0 0 2 1 0 0
Feb 14th to 19th Dow Declined
Solar Wind Speed 400 (estimate)
Analysis: Higher X-Ray levels with Stronger Optical (red period)
S Optical Rising with X Ray Levels Rising......
------------Trend Reverses
Flares
2014 02 24 171 205 1250 1 -999 B9.1 5 2 0 4 0 0 0
2014 02 25 174 157 910 0 -999 C1.0 4 0 1 11 1 1 0
2014 02 26 178 197 1060 3 -999 B9.5 3 1 0 11 1 0 0
2014 02 27 176 227 1170 0 -999 B9.8 12 0 0 15 0 0 0
2014 02 28 171 279 1220 2 -999 B9.7 6 1 0 9 0 1 0
Solar Wind Speed: 473
Feb 25th to 28th, dow rising
X-ray in decline with optical at strong levels.
Solar wind at good speed.......
Feb 24th to 28th, Dow rose
------------------trend continues
Flares
2014 03 02 161 170 960 1 -999 B8.3 7 1 0 14 0 0 0
2014 03 03 161 191 930 0 -999 C1.0 10 1 0 4 1 0 0
2014 03 04 158 160 760 1 -999 B8.8 10 0 0 1 1 0 0
2014 03 05 149 191 920 2 -999 B7.6 7 1 0 5 0 0 0
2014 03 06 149 174 540 2 -999 B5.5 1 0 0 2 0 0 0
Solar Wind speed at green levels (estimate)
Dow rose from 3rd to 7th
Analysis: Compatible solar wind speeds with strong decline in optical and x-ray combined for a strong green period.
---------------Reversal of Trend
flares
2014 03 07 148 161 740 0 -999 B5.4 2 0 0 0 0 0 0
2014 03 08 142 138 490 1 -999 B6.4 4 1 0 8 1 0 0
2014 03 09 146 123 340 0 -999 B9.3 14 2 0 27 1 0 0
2014 03 10 152 122 490 2 -999 C1.4 8 4 0 22 0 1 0
2014 03 11 165 108 540 0 -999 C1.4 7 2 0 11 2 0 0
2014 03 12 148 145 890 1 -999 B7.4 3 2 0 11 0 0 0
2014 03 13 148 130 850 0 -999 B7.3 2 1 0 4 0 0 0
kp
2014 03 07 148 161 740 0 -999 B5.4 2 0 0 0 0 0 0
2014 03 08 142 138 490 1 -999 B6.4 4 1 0 8 1 0 0
2014 03 09 146 123 340 0 -999 B9.3 14 2 0 27 1 0 0
2014 03 10 152 122 490 2 -999 C1.4 8 4 0 22 0 1 0
2014 03 11 165 108 540 0 -999 C1.4 7 2 0 11 2 0 0
2014 03 12 148 145 890 1 -999 B7.4 3 2 0 11 0 0 0
2014 03 13 148 130 850 0 -999 B7.3 2 1 0 4 0 0 0
March 7th to 13th dow in major decline
Solar Wind Speeds: 494
Analysis: Rising X-Ray and very stable S optical combined with solar wind speeds above average contributed to red period.
--------Reversal of Trend
Flares
2014 03 14 144 121 750 2 -999 B8.0 4 0 0 4 0 0 0
2014 03 15 139 141 1020 1 -999 B5.9 7 0 0 5 0 0 0
2014 03 16 136 139 930 1 -999 B6.0 4 0 0 2 0 0 0
2014 03 17 136 110 530 1 -999 B5.9 7 0 0 6 0 0 0
2014 03 18 138 125 520 3 -999 B5.6 5 0 0 4 0 0 0
Dow Rose from 14th to 18th
Solar Wind Speeds: Estimated at 350 levels
Analysis: Decline in Xray and Optical
_________________________________
What we can say is the reason the dow declined during this last forecast (sep 30th) was because there were more C class flares and the X-Ray Background Flux went above 4.1 (condition red period). It was the increase in solar activity S Optical Class flares the amplified the condition red period. (x-ray background flux levels). After these high S Optical flares ended around October 2nd, the dow started to rise (condition green period). So the Dow is expected to be stronger from October 6th to October 7th, 2014.
It appears our model still needs some work..............
As a final for our forecast on Tuesday, we can say with confidence that because this is a mid cross point period (end of a cycle occurring) that the Dow Jones Industrial Average will close higher on Tuesday September 30th, 2014 A.D. THIS COMPLETES EZ CYCLE #1
Notes used to make forecast on Sunday September 28th, 2014 A.D.
*** Decline in Kp levels after mid-peak
*** A peak in flux and than into decline
*** kp currently at mid range
*** air pressure in decline and due to rebound on Tuesday
*** higher 2mev on Tuesday peaking with the peak of solar flux energy creating a mini cross point period
*** solar wind heading towards 350
*** last condition yellow was about 5 days ago, no danger of one on or before Tuesday
*** current solar flux levels are at medium levels
You can find the data for this information by using the instrument panel shown below on this page.
Monday September 29th, 2014, we will forecast the Dow Jones position for Tuesday, September 30th, 2014. This will end the current sub-cycle. The next Sub Cycle is due to begin between October 6th and October 8th or October 12th, 2014 and October 14th, 2014, depending on the supercomputer forecast. Stay Tuned for exact dates..........
Published September 30th, 2014
The 2 levels of Condition Colors
There are 2 levels of condition colors, much like there are multiple levels of solar cycles.
An average solar cycle takes on average 11 years to fully complete itself. Each 11 year cycle is made up of smaller cycles that last approximately between 2.5 and 3 years each. Within each of these smaller sectional cycles, there exist short-cycles, which are called condition colors.
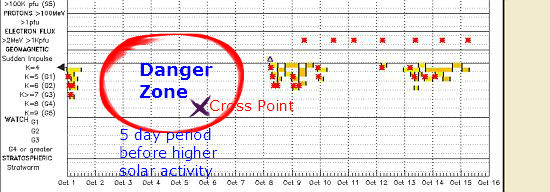
Each condition color also has its own cycle, which are termed subcycles and each of these sub-cycles have cross point periods, which show when the cycle completes itself. You can see from the image below, that a sub-cycle just completed itself and KP and Solar flux levels are starting to decline, showing the end of a cycle.
Link to NOAA Forecast of Solar Sunspot Activity
According to the image above, the Sub-Cycle Begins on October 14th, 2014, because the 10.7cm Radio Flux and KP levels start increasing. This is the start of the cycle and is where the condition blue begins.
Next in the blue circles, we can see a peak of the subcycle between October 16th and 17th, 2014. Now there are other cycles that are occurring within this time frame that our more sensitive instruments use to measure, however this just gives a general overall picture of how the subcycle works.
Now if this sub-cycle occurs when there are more S Optical flares, we have a level 2 condition color period. As the image shows below, the Optical S flares give a clue of how much energy is being put out by the sun, raising the condition color index to a level 2.
Link to Optical S Flares
Now each condition color within this cycle can have 2 levels associated with it.
The first level is the standard condition color levels, such as condition green with solar wind speed at 350, condition blue with increasing sunspots etc.
The second level is when the solar wind and sunspots exhibit the same behavior, but at much higher energies. This is most common when the S Optical solar flares are increasing or at high levels and most common from June to October of each year, the peak period of solar activity. In this case the solar wind can be declining for 3 days in a row and have solar wind speeds at 410 and be a level 2 condition green. The solar flux levels will increase when 2mev levels are shown to increase, showing a level 2 condition blue and so on. So we should gauge forecasting during summer/early fall months (in north america), to expect more level 2 conditions during this time period.
This means that there could also be higher condition red frequencies, which occur between 3.0 and 4.0 or 6.0 and 7.0 and higher condition blue frequencies which occur due to peaking 2mev levels. This follows the same pattern as a solar cycle with it's sub-cycles that are contained within it. So this needs further clarification.
Analysis for September 25th and September 26th, 2014.
This model appears to have a better success rate and we are going to continue using it from now on.
On September 25th, 2014, the Dow Jones closed down over 100 points and on September 26th, 2014, the Dow Jones closed up over 100 points.
On Wednesday September 24th, 2014 a Condition Yellow Occurred. This had the result of pushing the solar wind speed back up to above 350 or into the range of a condition red/orange.
A condition yellow can alter the course of a sub-cycle, temporarily turning it into a short term condition red/orange, usually lasting no more than 24 hours.
We can plot these unexpected condition yellows occurring in the future by watching for a spike in the KP levels, and also watching the forecast levels of KP activity forecasted by NOAA,
Link for Above:
http://www.swpc.noaa.gov/ftpdir/latest/RSGA.txt
The thing to remember is that the higher levels (Major/Severe Storm) forecasted by NOAA will cause the Dow Jones to Close Lower, especially if a condition yellow has just occured.
One very important point to remember, is that after high KP levels, the following lower KP period which occurs a few days later, is a period when the Dow Jones industrial average will close higher, because excessive KP levels cause a condition red to occur, as shown in the image below, the blue circles represent the moderate KP levels.
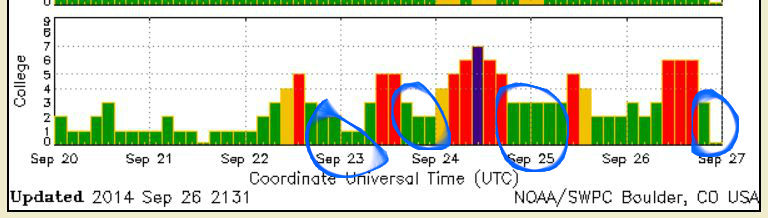
Moderate/Decline in KP - Solar Wind Takes Priority in Readings and override KP level readings
High/Excessive KP - Moderate KP levels take Priority in readings and override Solar Wind Speeds
On September 26th, 2014, because it is so close to a new moon, the solar wind speed declined faster than usual after the condition yellow and the 2mev electrons were higher. In most cases a new moon causes lower solar wind speeds. This contributed to the condition blue period that began when the condition yellow occurred on Wednesday. As of Friday there were 25 S Class solar flares, showing that the condition blue was well underway, contributing to a higher Dow Jones on Friday. Solar wind speeds on Friday were at 445, leading us to conclude that the moderate KP levels were what contributed to a stronger Dow Jones on Friday, September 26th, 2014. The condition yellow seemed to act as a type of "interference" in the subcycle.
So in closing 2 valuable lessons were learned from this forecast.
1: A sudden jump in KP levels, solar wind speed levels and solar flux levels (condition yellow) can cause a weaker Dow the following trading day and is only temporary.
2: KP levels, that occur just after a strong period of high KP activity and are more moderate can cause a stronger Dow Jones under the right conditions and can override the solar wind speed when the conditions are right.
Forecast For the Dow Jones for the week of September 22nd to 27th, 2014.
Cycle #1 starts when Solar Flux Levels begin to rise, possibly starting Tuesday, Wednesday. KP Levels are due to Peak this Friday and Saturday. This Peak in KP Levels will occur during a Decline in Solar Wind Speed. High KP levels are due to start peaking on Wednesday, September 24th, 2014. Because this date is NOT A CROSS POINT DATE, (solar flux is increasing, rather than peaking) there is forecasted increased Solar Flux, meaning a strong condition blue period will manifest during this time, also contributing to a stronger Dow Jones towards the end of the week. As of September 22nd, 2014, solar flux values are flat (condition purple). Because solar wind speeds are forecast to decline, KP values will likely be moderate, leading to a condition green. Also KP values also peak on Saturday, meaning a the Dow Jones likely will close higher on Thursday, September 26th and Friday, September 27th, 2014. There is also an upcoming Solar Eclipse on October 23rd, 2014, which is usually associated with a lower Dow Jones during October of this year.
..............Stay tuned for more forecasts in the days ahead.
Updated September 17th, 2014.
Our recent model does not appear to be gaining any results, so we are going to try our next model, by looking at solar activity as a cycle. Because a complete solar cycle takes 11 years, this 11 year cycle contains within it sub-cycles, which has solar activity occurring in an average 11 day cycle. More about this can be learned on ez3dbiz.com.
This means the start of each sub-cycle will begin 4 days before the peak of KP activity, as the peak of a solar flare means a peak in KP activity. Within this 11 day sub cycle there are also additional sub-cycles made up of the sun's solar flux and the 2mev protons, which are both interconnected.
We shall begin our first cycle called EZ Cycle 1 - September 2014.
1 - Condition Blue - The Start of the Cycle.
Use 2mev and solar flux activity (increasing) to find the first stage of the sub-cycle occurring. During this time the forecast is based on 2mev peaks/rising and the increase in the sun's solar flux. This period can last between 24 hours and 3 days, until the first KP peak begins, which is the peak of the solar flare or 50% into the sub-cycle. The way to find this cycle is to look 4 days before the start of KP activity.
The start of a sub cycle always begins with increasing solar flux activity (more sunspots). Accompanying this increased solar flux activity is a change in the local weather, also called the weather microclimate. It may change from dry to wet, cool to warm, calm to windy or any other manner of conditions. When this occurs, we are at the start of the condition blue, which starts the sub-cycle.
Future KP Levels
Long Range KP Forecasting
In some cases, Optical Levels and the X-Ray background flux levels may not rise significantly and this may result in a strong condition green period. At stages 1 and 2 during this cycle, the 2mev readings take priority.
3 - Cross Point/Peak. Condition Red or Green Period.
During this time, the future Dow forecast is based on the following:
If this cross point date occurs during a Saturday, the results will manifest on Friday. And in some cases if it occurs on a Sunday, the results may manifest on a Monday. This is the cross point peak period. The Dow may either fall or rise depending on various factors such as. A Weaker Dow:
Mars Leaving 24 degrees - Higher
Solar Wind Speed Jumps to above 350 - remains at high levels
Solar Eclipse occurring within 30 days
Solar Eclipse Dates
2014 Oct 23
2015 Mar 20
2015 Sep 13
2016 Mar 09
The months of September to October
Extremely High X-Ray Background Flux Levels
During Cross Point Peak Periods, 2mev Readings are Discarded during this phase.
4 - Condition Green - Decline of Cross Point/Peak. Dow usually rises based on moderate KP levels, lower than occurred during cross point/peak, as shown in the image below that moderate KP levels are benefical, but strong to severe will cause the dow to close lower the following day.
Shown in the image below the best period is just after multiple red dots, or higher solar acitivity. After this higher solar activity, Optical levels drop and a condition green occurs.
View Real Time Previous Sunspot Activity
Optical dropping increases condition green periods.
Readings of X-Ray background flux levels are ignored during this time.
Dow Rising in This Cycle Based on:
Future KP Forecasts lower/moderate
Real Time KP Forecast for Extreme/Moderate KP Storms:
Access Previous Forecasts for Severe to Moderate KP Storms:
At this point in the cycle we base the future KP levels based on previous KP levels. If KP levels were extremely high at the cross point peak, the moderate KP levels may occur during this phase leading to a strong condition green occuring.
Solar wind levels are discarded during this time, with a lower wind speed entering into the 350 range being most beneficial. Solar wind speeds declining after the cross point peak are especially beneficial also.
5 - End Stage. Condition Purple. At this phase, the sub-cycle has completed itself, solar wind speeds, solar flux and KP levels are flat or dropping.
From this point on, the old model is discarded and the new above model takes effect.
Between the 24th and 26th of September 2014 a.d. will be the next date of posting whether the dow will close lower or higher at the end of the trading day. This is the next cross point period and we feel confident we will have a positive predictive result using our new model.
Because the solar wind is going to enter the range of 350 at this cross point date, the DOW Jones will close higher between the 24th and 26th of September 2014. Because this will be on a weekday, it should make for an accurate forecast. The exact date will be posted before the 24th of September 2014.
Using our new Model, we make the forecast that the Dow Jones Industrial Average will close Lower on Monday, September 15th, 2014.
Analysis of Sept 15th, 2014.
The Dow Closed higher on September 15th, 2014. It appears that the effects of the Solar Wind are strongest during the first 24 to 48 hours after they "jump" to higher wind speeds or enter the 350 range. Making forecasts after this period is much harder to do, as we can see from the September 15th, 2014 results. Future forecasts will be based on these higher extreme parameters, as predictive results are much easier to obtain using this method. The projected higher KP levels never manifested today and instead have been re-forecasted by NOAA to manifest on Tuesday, September 15th. If KP had been higher today, the dow would have closed lower. BECAUSE OF THE APPROACHING NEW MOON, SOLAR WIND SPEEDS ARE GOING TO REMAIN HIGH, AND HIGHER KP ON TUESDAY WITH HIGH SOLAR WINDS THE DOW WILL LIKELY CLOSE LOWER ON TUESDAY, SEPTEMBER 15TH, 2014. ALTHOUGH THIS IS NOT A CROSS POINT DATE.
September 14th, 2014 - New Forecasting Model Added Below
Summary =
Blue and Green = Dow Closes Higher
Orange and Red = Dow Closes Lower
|
Higher 2mev + Entering 350 Solar wind = Green
|
Solar Wind Panel |
Forecasting 350 Solar Wind Speeds for an upcoming condition
green period. A decline in the solar wind from high speeds,
entering 350 on the day KP levels peak will indicate a green
period. This is sometimes accompanied by an increase
in 2mev levels, adding a condition blue. |
2mev Panel |
Orange and Red = Dow Closes Lower
Extreme KP Levels Forecast with higher 2mev's. Solar Wind will Jump
on 2mev Forecast Day = Orange |
KP Forecast Panel |
By using our information, we can know in advance when the KP levels
are going to be above average, the Solar Wind Speed is going to be
above 350 and when the 2mev levels will increase |
Long Range KP Panel |
All other peaks in KP activity that don't match the above 2 requirements,
use the fine tuning.html variables for forecasting.
Future KP Levels and Real Time KP Levels
http://www.paradiseexcursion.com/kp_forecasting.html
2mev Panel
Solar Wind Panel
Monday September 15th, 2014. Higher Kp Activity is forecast again, with possible lower solar wind speeds. This may be a period for a stronger Dow Jones. Stay posted for confirmation on Sunday September 14th, 2014.
Analysis for Friday September 12th, 2014.
High Speed Solar Winds (orange) combined with Strong Negative KP Activity (orange) peaking on Saturday, caused the Dow to Close Lower on Friday, September 12th, 2014. This was a major cross point period, instead of a minor cross point period, due to the stronger than usual KP activity and high speed solar winds. Instead of fine tuning used, solar wind speed should have been used to make the forecast. Because KP levels were forecast with such strength and above average activity, this could be a future clue to higher speed solar winds, which will be observed in the future.
KP Levels peak this Saturday, Sept 13th, 2014. This means the effects will manifest on Friday the 12th. The 2mev Electrons are also forecast to peak on this date. This means there is a minor cross point occurring and is highest within a 5 day period of KP activity. Condition color is red. Solar Wind Speeds are higher and forecast to remain at high speeds (orange). Because this is not a major cross point period, we are using lesser fine tuning instrument variables to clarify the forecast. The high speed solar winds and higher KP periods have run their course, causing the dow to close lower the previous few days. Our fine tuning instruments show a change in activity, indicating a reversal in the dow direction. Therefore we predict that on Friday, September 12th, 2014, the Dow Jones will close higher.
KP peak on Saturday September 13th, 2014. KP Begins Peaking early Friday Morning, lasting until Saturday. Solar Wind Speed expected to remain at around 350 (green). Solar Flux is at high levels (red). 2mev's Forecast to be lower on Friday. Conclusion - Dow Jones is forecast to close higher on Friday, 12th of September 2014. A.D. CHECK BACK THURSDAY AFTERNOON AFTER FINE TUNING HAS BEEN COMPLETE FOR FINAL PREDICTION.
September 13th, 2014 is the next time of the peak in KP activity, which is on a Saturday. This means the energy will be reflected in the markets on Friday September 12th, 2014 A.D. We will post the position of the dow on Thursday September 11th, 2014 to give the forecast of whether the dow will close higher or lower on Friday September 12th, 2014. A.D.
ParadiseExcursion.com makes the forecast that on Monday September 8th, the Dow Jones will close Lower, due to higher speed solar wind speeds (condition orange), a declining soalr flux (condition orange) and the alignment of Mars with the Sun (a time of more fear). Result - The dow closed down lower on monday September 8th, 2014, and on Tuesday September 9th, 2014 dropped significantly. This information is based on the cross point that occured on Sunday September 7th, 2014. Also we are entering the "fear zone" of where mars aligns with our sun as our daily dow page shows. Also during this time of year, sharp drops in the dow are more common, because geomagnetic storms are stronger.
Lessons learned from the Sept 5th, 2014 Dow Jones Forecast/Prediction.
Analysis from September 5th, 2014 Dow Prediction Forecast.
Because there was a strong KP peak, peaking on Saturday September 6th, I believe that this energy eclipses or is stronger than the previous KP peak that occurred a few days ago. Also the solar wind entered a new condition green period or (wind speed approaching 350) and the condition red energy (high x-ray background flux of 4.0 and higher) was longer than 2 days, meaning that the negative effects of the red had passed. Future forecasts will be based on a the strongest KP peak within a 5 day period, and giving first condition to the position of the solar wind. It appears that using the solar wind as a main measurement, at these cross points, rather than the not always accurate KP storm strength forecast has more accuracy during these times. Next cross point forecasts will pay more attention to solar wind speed, rather than KP levels. This may mean that during cross point periods where there is a peak, the solar wind position takes priority. And during times of lower cross point periods, or just after we can use the more lighter parameters to predict the next position of the Dow Jone.
Even though I have been wrong every single time, lessons are being learned, which hopefully will lead to more accurate forecasts in the future. This is only a testing model and at no time in history has there been the tools made available to learn how to forecast the DOW Jones. So far there are 36 more tests to go, out of a total of 40 tests.
Because this next cross point occurs on a Saturday, we are going to post the next date on Friday September 5th, 2014, as cross points falling on Saturdays always manifest their results on Fridays. On Friday September 5th, 2014, the Dow Jones is forecast to Close LOWER.The weaker dow is due to KP level activity in the high ranges on Saturday. The dow will close lower also due to an approaching full moon and higher X-ray Background levels above 4.0 (condition red).
Thursday September 4th, 2014 the Dow Jones Industrial Average is Forecast to Close Higher. This is due to re-entering the 350 Solar Wind Speeds (condition green) and X-Ray Background Levels dropping below 4.0 (leaving condition red). Be sure to check back on Wednesday September 5th.
There is also the beginning of increasing Solar Flux Activity (a strong condition blue), making this a perfect window for the Dow Jones to Close Lower on Thursday September 4th, 2014. A.D. On Thursday, September 4th, 2014, the Dow Jones closed down 8.70 (0.05%). Although all the conditions for a higher dow were in place, the dow was strong throughout most of the day and closed a little bit lower. Air Pressure and Cosmic Rays showed low levels, indicating a weaker dow.
Date of last Post Between August 30th, 2014 and September 1st, 2014 A.D.----- Because the cross point energetic date falls on a Sunday, as we show in our in-depth article, the forecast is not possible.
The Dow Jones Industrial Average will Close Lower on Wednesday August 27th, 2014 A.D. - This is due to the current solar conditions - A Peak in 2mev, Kp Levels Peaking (condition Orange), Solar Flux Dropping (condition Orange), Solar Wind Speed Below 350.
On Wednesday August 27th, 2014, the Dow Closed Up 15.31 (0.09%)
On Thursday August 28th, 2014 we forecast the Dow Jones to Close Higher on this date. This is due to the solar wind speed reaching 350 (green), and a peak in 2mev protons (blue) and a peak in KP Levels (motivational).
On Thursday August 28th, 2014, the Dow Closed down 42.44 (0.25%).
Lessons Learned From Last Post:
The Forecast for a Lower Dow Jones was made 24 hours too early because KP levels did not peak until Thursday August 28th, 2014.
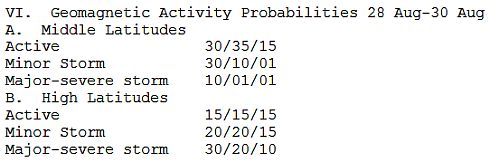
The KP storm that occurred was major/intense, which can be seen below:
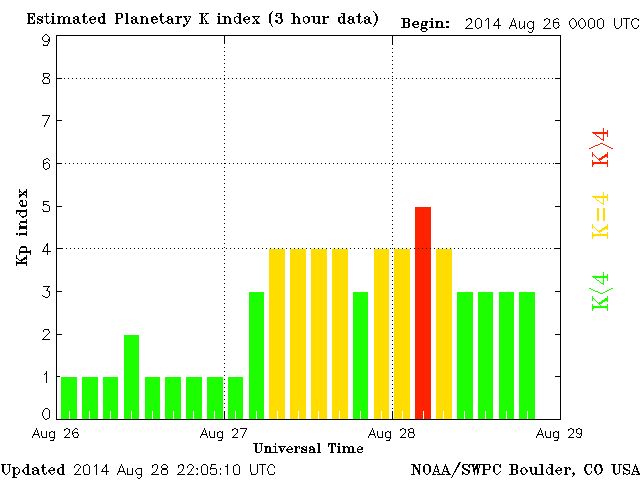
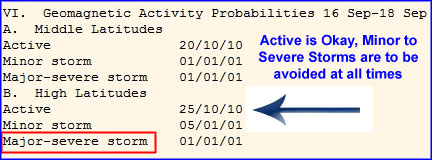
These type of KP storms cause the Dow to Close Lower, and it did so during the KP storm, and not before. The Image below, taken from our research page shows that active is okay for the Dow to Close higher and Minor to Severe Storms cause the dow to close lower.
If we look at the conditions for August 28th, we see the following:
If the KP storm had been lower and not as strong, with the KP looking like below with not a high number of yellow bars, but in a strong mid green range.
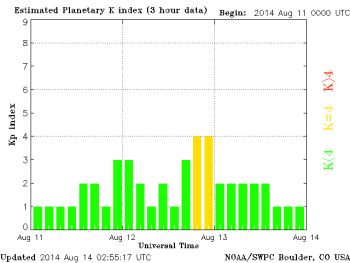
The DOW would have closed higher if the KP values looked like the above, because the Solar Winds were at 350. In this case the much stronger KP values outweighed the recent solar wind speeds. This was really a condition orange.
In Summary, the negative effects of the KP storm did not become felt in the dow jones until approximately 6 hours into the KP storm. So furure forecasts will be based on this correction.
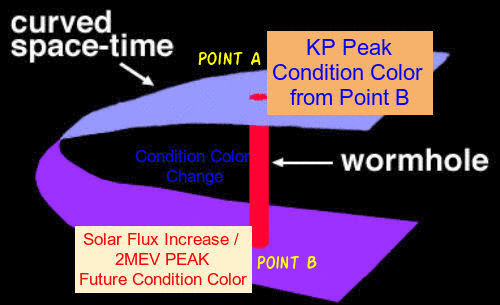
This website is a research arm of EZ3DBIZ.com, based on discoveries of "mini wormholes" that occur at certain points when solar activity is higher. We are using these miniature wormholes to receive information from the future to the present, when the right solar conditions prevail, which is on average every 7 to 11 days or more, so it is key to check this page every 2 or 3 days for when the next forecast is posted. This website will use the Dow Jones as an example, closing higher or lower according to the information received in advance with a goal of 100% accuracy. The forecast for a higher Dow Jones will be posted 24 hours in advance of the date of the Dow Jones results.
An example of receiving information from the future is when sunspot counts decline for 3 or more days and the solar wind is above 350, brings the information of chaos and violence to the present, as this research page shows. We can also use this technology to plot future dangerous events, such as major periods of violence, unrest and terror attacks and other periods public safety may be at risk. Because there is so much data on the Dow Jones, it makes it an excellent platform to test our model and theory in the coming months ahead.
Future KP Levels and Real Time KP Levels
http://www.paradiseexcursion.com/kp_forecasting.html
2mev Panel
Solar Wind Panel
The formulas and equations are listed below:
The WIM Formula
Wim is short for Wormhole Information Matrix. The formula is expressed as follows:
For a condition blue or Green and the Dow Jones to Close higher the Following Trading Day
A + M = Z. A is dependent on the amount of energy received by Z, in order for a clear information to be obtained. Where A represents a Peak in KP activity and M represents the condition color and Z the peak in 2mev or stronger solar flux periods that cause a condition green or blue to occur.
M is dependent upon the complete peaking of energy expressed by Z, in order for change of a condition color to blue or green to occur.
For a condition orange, red or purple or the Dow to Close Lower the Following Trading Day
Z can be interchangeable, having quantum properties, in that when Z becomes less stronger (dropping sunspots) and A shows a strong peak, M, representing the condition color will change to Orange, Red or Purple.
This means the ever changing state of M, not only contains quantum values, but is dependent on the sharp peaks expressed by both A and Z.
Where a condition yellow fits into this needs further research. Also Z, may also include 2mev particle peaks, although further research is needed to add this to the WIM Equation.
In Summary, we can write a simple interface for the Dow to Close higher 24 hours in advance at the end of the trading day as follows:
Peak Periods in KP activity, and a peak in 2mev levels or Solar Flux Activity (both 2mev and solar flux levels are very similar) combined with a future condition green/blue period (or when the solar wind speeds are at 350), will cause the Dow Jones Industrial Average to closer higher in the next 24 hours. The formula of this forecast increases substantially when the Optical S flares are higher.
Recommended Reading to understand Cross Point Periods
A Review of the Dow Prediction on August 13th, 2014.
On August 13th, 2014, EZ3DBIZ forecast the dow jones to close higher at the end of the trading day, of which it closed up approximately 90 points higher.
The crest/wave rises and falls. This energy can be peaks of 2mev energy, solar flux or KP energy. The pressure released by the 2mev peak are strongest when they occur within 6 hours of the peak of KP activity. The 2mev's release this pressure and take on the attributes of the condition color which becomes stabilized by the solar flux.
August 14th, 2014 was a small cross point because the KP peak and the start of the solar flux activity occurred within 6 hours of each other, resulting in a new condition blue, after a quiet orange/purple period.
The x-ray background flux levels were below 4.0, and less than 3 days below 4.0, indicating no condition red was present, which can result in a lower dow, also the solar wind was in a slow decline, due to the full moon, heading into a new and recent condition green period, a time of both a blue and green, perfect for a stronger dow jones, possibly for 2 to 3 days thereafter.
Receiving Information through the Solar Activity Wormhole
The information from the future comes through at the peak KP periods. The energy comes from the higher 2mev and stronger solar flux periods.
We can think of the KP peaks acting as a speaker to listen to the information sent through the wormhole at the other end by the higher/stronger solar flux / 2mev protons. The wormhole time period lasts from 1 to 4 days, meaning higher solar flux 4 days away from a peak in KP connects both points. If condition green is at days 3 and 4, when solar flux is higher, than at day 1 where KP peaks, will give us the information that the dow will close higher on day 1 or the day KP peaks within that 3 to 4 day period. In many cases the stronger the cross points or peaks, the further out the 2mev will be, or "stretched".
As the energies increase and reach strong cross points, the days for the 2mev cross peaks will stretch further and further out or "expand".
At higher KP peaks and during medium solar flux levels, the 2mev's will be closer to the KP peak, making prediction faster.
If the dow has already rose significantly and the energetic cross peak has already occurred, than this energy has already been released and forecasting should proceed with extra caution. Another cautionary period is condition yellows, if one has not occurred in some time, it may occur suddenly making forecasting a little more of a challenge.
Polarities of condition colors can change from higher solar flux levels and 2mev peaks from blue and green to orange and red, or vice versa.
Or a condition red for a long period may suddenly change to a green, as the x-ray background flux levels start dropping. This change may be caused by the 2mev peak.
The distance between both points does not matter, what matters is the energy that provides or carries the data to the KP point.
The august 14th, 2014, dow rise rose because a long condition ornage was just ending and new cycle of green and blue was just emerging. This polarity from orange to green/blue was caused by the increased solar flux and 2mev protons.
Recent solar flux and 2mev protons gives an upcoming condition color strength and a condition colors strength depends upon how long it has been previously active. If the condition color has been the same for 3 or more days and a stronger solar flux is occurring with higher 2mev's, than the condition color will change polarity to a different color.
Does Higher 2mev cause Increased Solar flux and Vice Versa?
If this is true, than we have a rough guide to know when the solar flux will increase, as 2mev forecasts are good for up to 3 days in advance. It just happens that this is true. Below is a short summary of the data that occurred on July 20th, 2014. I used this date because the data is very clear.
As we can see a peak in 2mev at 8.0 and when we look at the GOES electron flux, we see the red line climbing higher on this date.
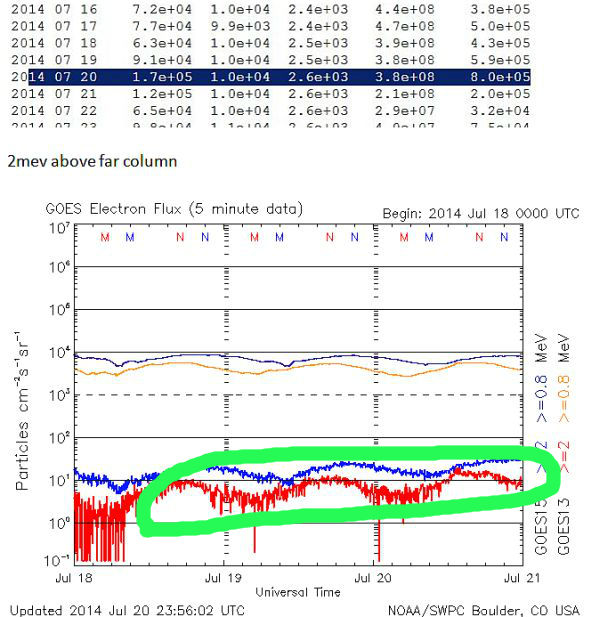
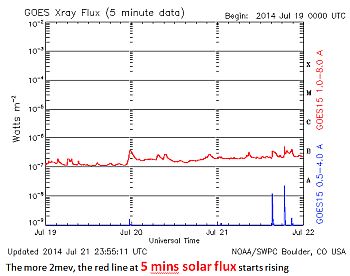
Now was this change reflected in the solar flux levels? Yes, we see the red line slowly rising on the 20th and heading upwards, showing proof that higher 2mev's give a rough idea of when the solar flux is going to rise also.
Sources:
Solar Flux Warehouse:
http://www.swpc.noaa.gov/ftpmenu/plots/xray.html
Real Time 2mev protons
http://www.swpc.noaa.gov/rt_plots/elec_3d.html
Complete Solar Warehouse
http://www.swpc.noaa.gov/ftpmenu/warehouse.html
Electron Warehouse
http://www.swpc.noaa.gov/ftpmenu/warehouse/2014/2014_plots/electron.html
Recent 2mev archive:
http://www.swpc.noaa.gov/ftpdir/indices/old_indices/
Real time solar flux
http://www.swpc.noaa.gov/rt_plots/xray_5m.html
Real time electron flux
http://www.swpc.noaa.gov/rt_plots/elec_3d.html
Real Time 2mev protons
http://www.swpc.noaa.gov/rt_plots/elec_3d.html