News

01-27-2013
 New Books
Visit the Books Page on the homepage to See our Latest Releases
New BooksVisit the Books Page on the homepage to See our Latest Releases
Analysis of the Paris Attacks of 13-14 November 2015
As a hobby I study solar weather for health and safety to avoid being in the wrong place at the wrong time. The Paris Event all follows the same pattern that occurred on 911 and the Boston Marathon Bombings which I have shown in my report on this page below:
http://www.ez3dbiz.com/earth_behavior.html
The prime indicator is always a decline in sunspots or the sunspot area for 3 or more days in a row. This is a period where solar activity is cooling down. Let's take a look at the data:
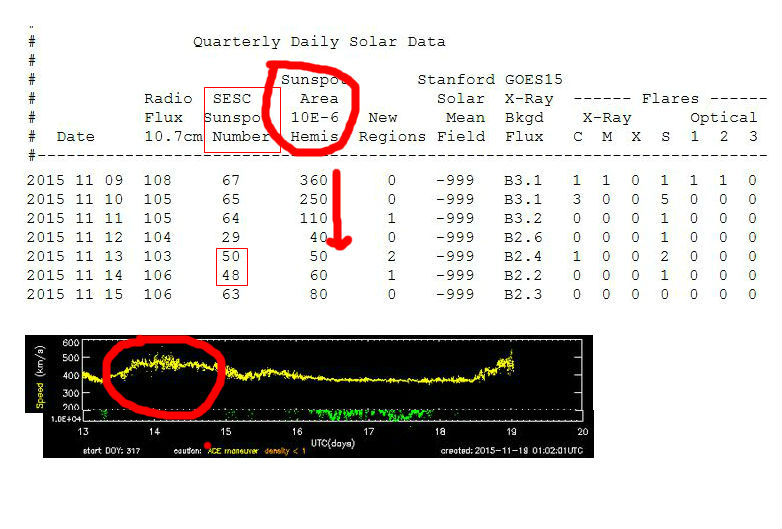
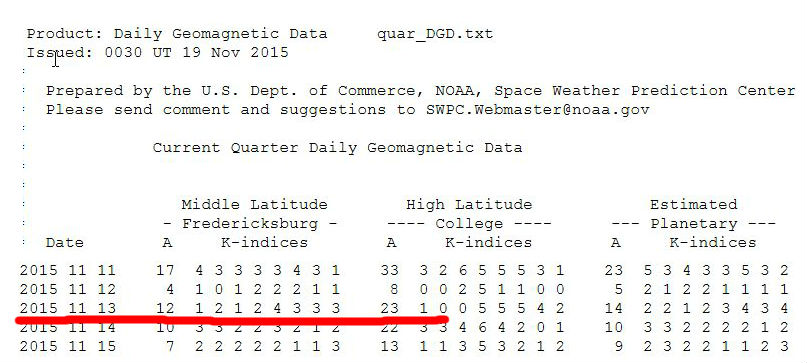
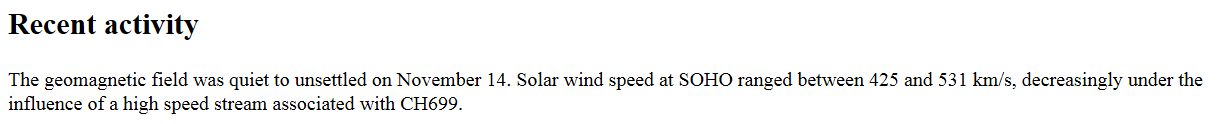
The yellow line above is the solar wind speed. We can see it "jumped" on the date of the attack. Below we have the KP activity, which is known as "the motivator".
Source: Solen Solar Weather Historical Database
http://www.solen.info/solar/old_reports/2015/november/20151115.html
KP
ftp://ftp.swpc.noaa.gov/pub/indices/old_indices/2015Q4_DGD.txt
Sunspot
http://legacy-www.swpc.noaa.gov/ftpdir/indices/old_indices/2015Q4_DSD.txt
Please note NOAA archives the most recent activity in quarters so after a few months you need to look at the archive to retrive the data.
Thank You for visiting our site and reading our articles and new update. If this information has helped you or someone you know, please consider contributing to this site. Your contribution will ensure the continued publishing of unique and quality articles at no cost to all of our visitors and regular readers.