News

01-27-2013
 New Books
Visit the Books Page on the homepage to See our Latest Releases
New BooksVisit the Books Page on the homepage to See our Latest Releases
Latest Dow Prediction Forecast Analysis - Return to Homepage
View the Analysis for the Dow Prediction for August 4th, 2014
Recommended Reading to understand Cross Point Periods
A Review of the Dow Prediction on August 13th, 2014.
On August 13th, 2014, EZ3DBIZ forecast the dow jones to close higher at the end of the trading day, of which it closed up approximately 90 points higher.
The crest/wave rises and falls. This energy can be peaks of 2mev energy, solar flux or KP energy. The pressure released by the 2mev peak are strongest when they occur within 6 hours of the peak of KP activity. The 2mev's release this pressure and take on the attributes of the condition color which becomes stabilized by the solar flux.
August 14th, 2014 was a small cross point because the KP peak and the start of the solar flux activity occurred within 6 hours of each other, resulting in a new condition blue, after a quiet orange/purple period.
The x-ray background flux levels were below 4.0, and less than 3 days below 4.0, indicating no condition red was present, which can result in a lower dow, also the solar wind was in a slow decline, due to the full moon, heading into a new and recent condition green period, a time of both a blue and green, perfect for a stronger dow jones, possibly for 2 to 3 days thereafter.
Receiving Information through the Solar Activity Wormhole
The information from the future comes through at the peak KP periods. The energy comes from the higher 2mev and stronger solar flux periods.
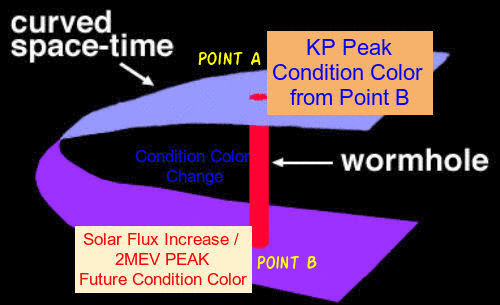
We can think of the KP peaks acting as a speaker to listen to the information sent through the wormhole at the other end by the higher/stronger solar flux / 2mev protons. The wormhole time period lasts from 1 to 4 days, meaning higher solar flux 4 days away from a peak in KP connects both points. If condition green is at days 3 and 4, when solar flux is higher, than at day 1 where KP peaks, will give us the information that the dow will close higher on day 1 or the day KP peaks within that 3 to 4 day period. In many cases the stronger the cross points or peaks, the further out the 2mev will be, or "stretched".
As the energies increase and reach strong cross points, the days for the 2mev cross peaks will stretch further and further out or "expand".
At higher KP peaks and during medium solar flux levels, the 2mev's will be closer to the KP peak, making prediction faster.
If the dow has already rose significantly and the energetic cross peak has already occurred, than this energy has already been released and forecasting should proceed with extra caution. Another cautionary period is condition yellows, if one has not occurred in some time, it may occur suddenly making forecasting a little more of a challenge.
Polarities of condition colors can change from higher solar flux levels and 2mev peaks from blue and green to orange and red, or vice versa.
Or a condition red for a long period may suddenly change to a green, as the x-ray background flux levels start dropping. This change may be caused by the 2mev peak.
The distance between both points does not matter, what matters is the energy that provides or carries the data to the KP point.
The august 14th, 2014, dow rise rose because a long condition ornage was just ending and new cycle of green and blue was just emerging. This polarity from orange to green/blue was caused by the increased solar flux and 2mev protons.
Recent solar flux and 2mev protons gives an upcoming condition color strength and a condition colors strength depends upon how long it has been previously active. If the condition color has been the same for 3 or more days and a stronger solar flux is occurring with higher 2mev's, than the condition color will change polarity to a different color.
Does Higher 2mev cause Increased Solar flux and Vice Versa?
If this is true, than we have a rough guide to know when the solar flux will increase, as 2mev forecasts are good for up to 3 days in advance. It just happens that this is true. Below is a short summary of the data that occurred on July 20th, 2014. I used this date because the data is very clear.
As we can see a peak in 2mev at 8.0 and when we look at the GOES electron flux, we see the red line climbing higher on this date.
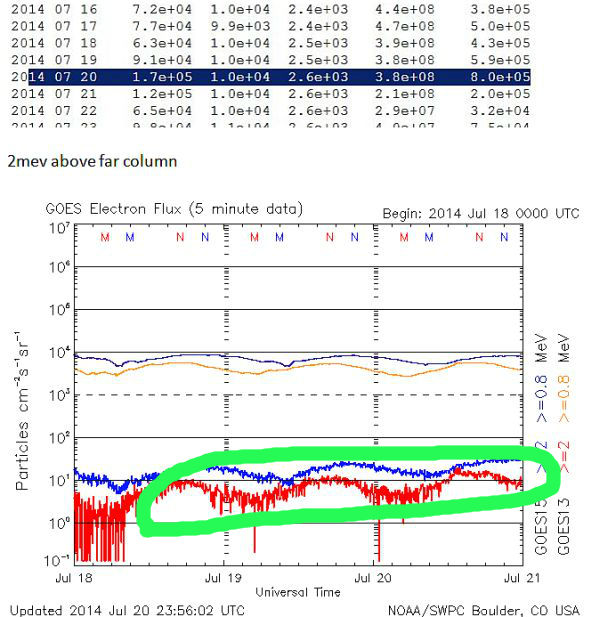
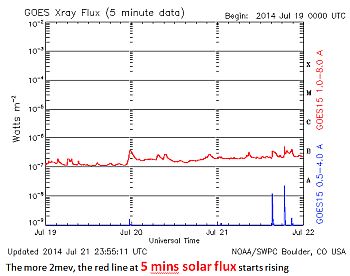
Now was this change reflected in the solar flux levels? Yes, we see the red line slowly rising on the 20th and heading upwards, showing proof that higher 2mev's give a rough idea of when the solar flux is going to rise also.
Sources:
Solar Flux Warehouse:
http://www.swpc.noaa.gov/ftpmenu/plots/xray.html
Real Time 2mev protons
http://www.swpc.noaa.gov/rt_plots/elec_3d.html
Complete Solar Warehouse
http://www.swpc.noaa.gov/ftpmenu/warehouse.html
Electron Warehouse
http://www.swpc.noaa.gov/ftpmenu/warehouse/2014/2014_plots/electron.html
Recent 2mev archive:
http://www.swpc.noaa.gov/ftpdir/indices/old_indices/
Real time solar flux
http://www.swpc.noaa.gov/rt_plots/xray_5m.html
Real time electron flux
http://www.swpc.noaa.gov/rt_plots/elec_3d.html
Real Time 2mev protons
http://www.swpc.noaa.gov/rt_plots/elec_3d.html
Thank You for visiting our site and reading our articles and new update. If this information has helped you or someone you know, please consider contributing to this site. Your contribution will ensure the continued publishing of unique and quality articles at no cost to all of our visitors and regular readers.